
UI/UX
Data Design
Web
Mobile
Analytics
Market Today, Business Today
Intro
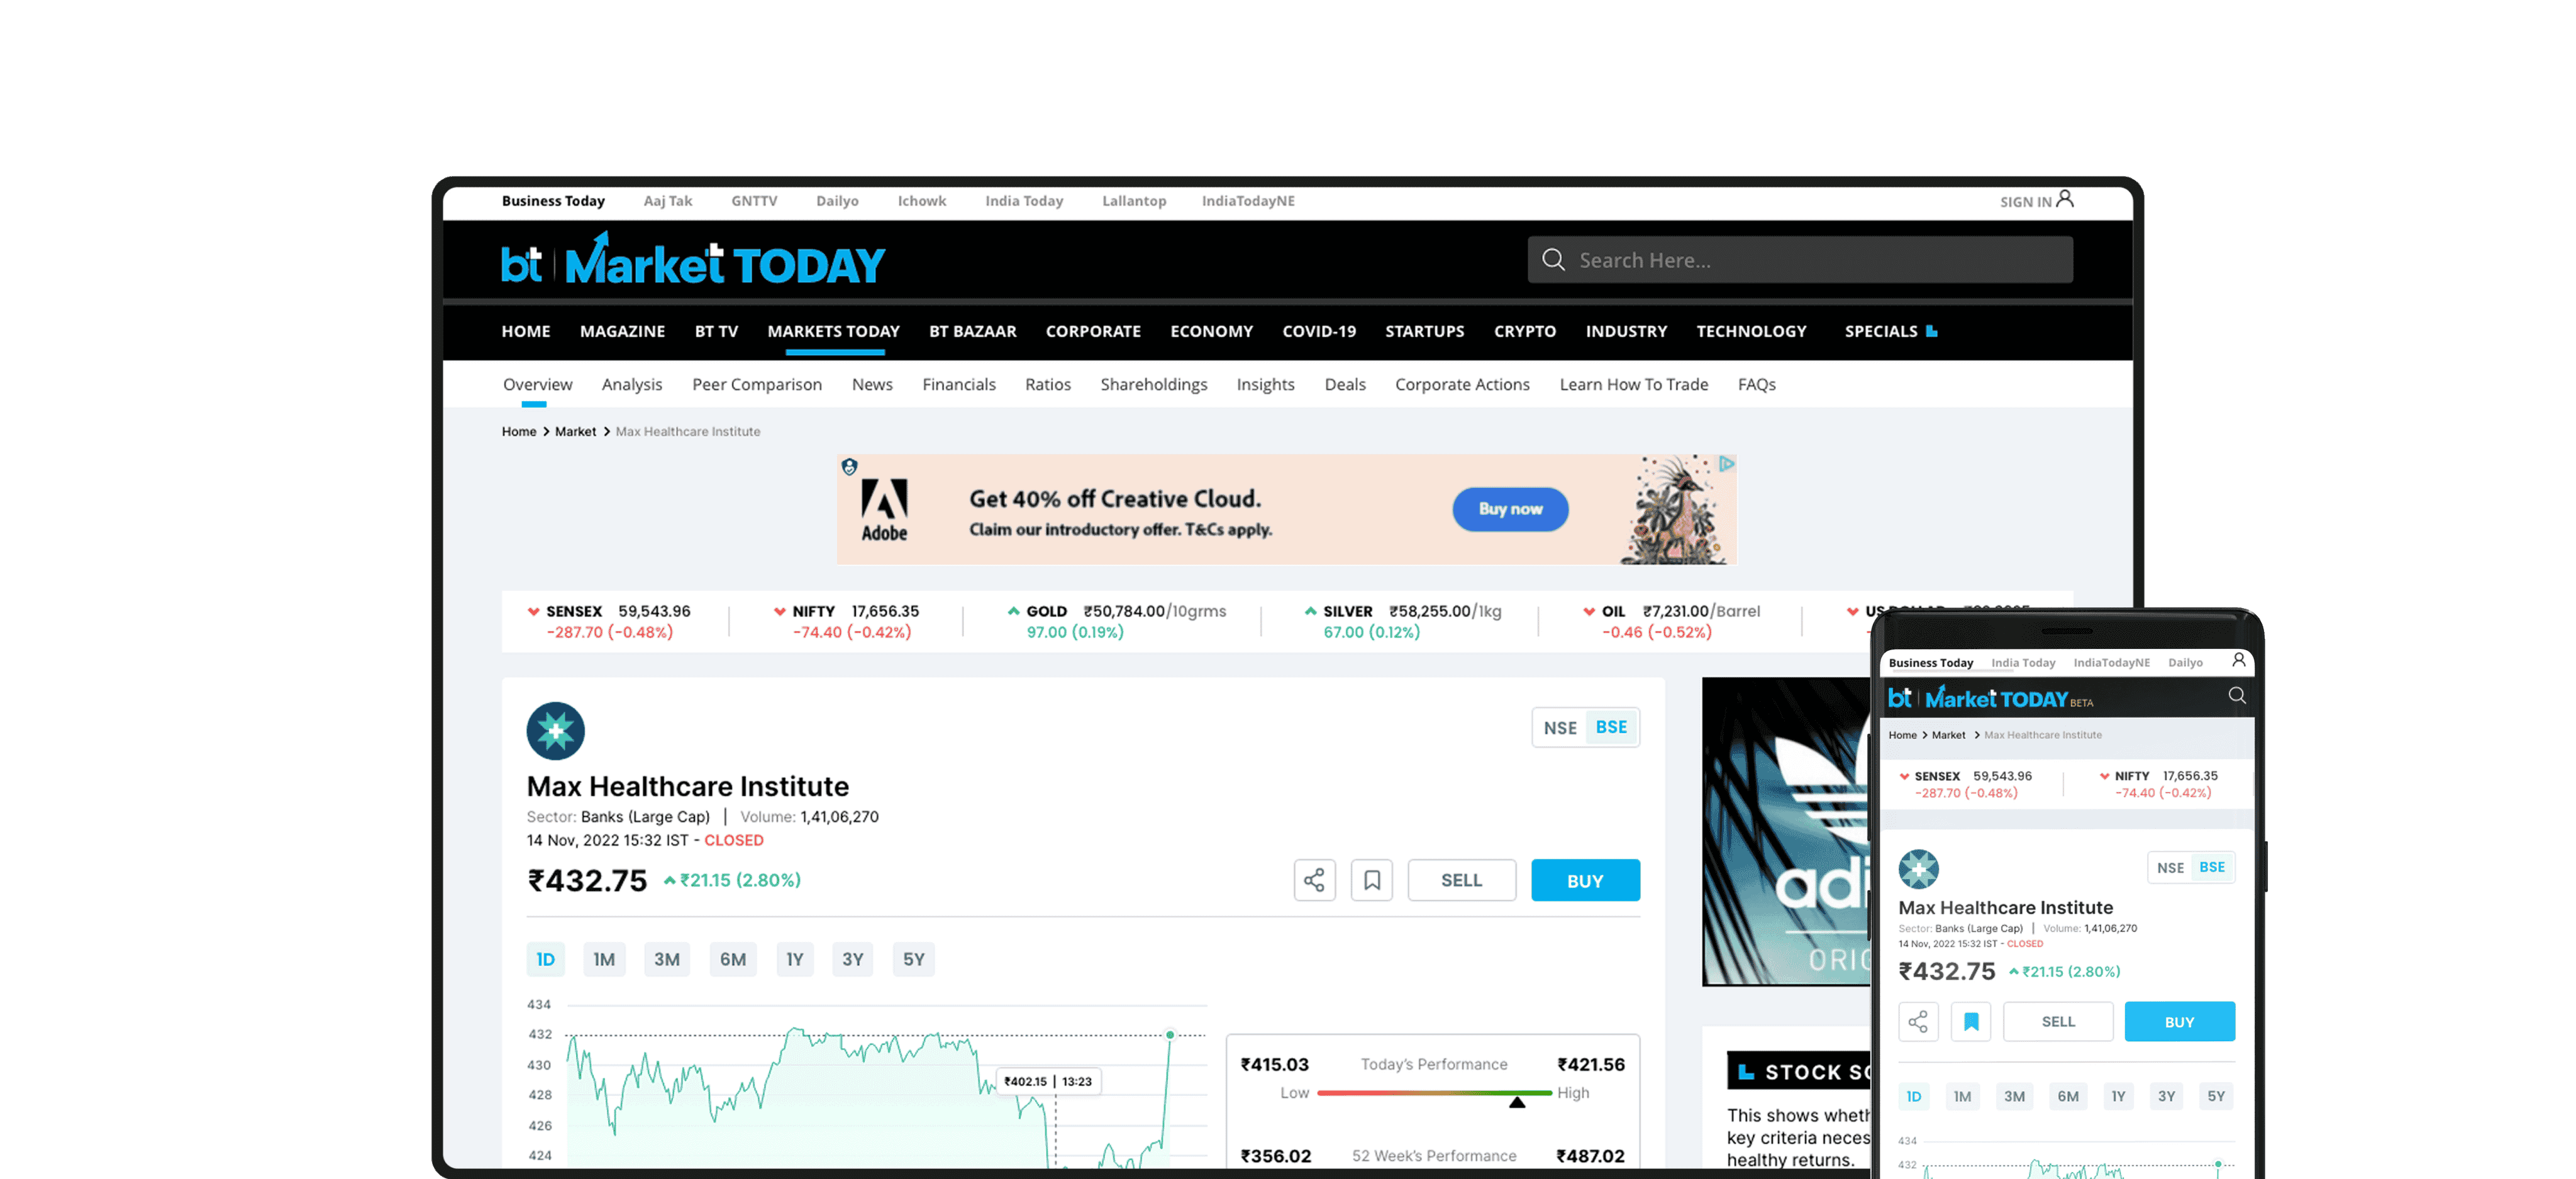
The project involved building the stock market platform for Business Today (https://www.businesstoday.in/markets) from scratch. The website serves as a leading online platform for providing up-to-date information, news, and analysis related to the financial markets and business sectors.
Its target audience primarily consists of investors, traders, professionals, and individuals interested in staying informed about market trends and developments.
Duration
8 weeks, 2022
Role
I worked as a UX & Data Designer, collaborating closely with the Project Leads, BA's and team of developers.

It is a comprehensive platform that covers various aspects of finance, including stocks, mutual funds, commodities, currencies, IPOs, and more. The website offers real-time stock quotes, expert opinions, financial analysis, and tools such as portfolio tracking and market watchlists. Moneycontrol is a popular website among investors, traders, and anyone interested in keeping up-to-date with the latest financial news and trends in India.
Goals and Objectives:
User-Centric Design: Focused on delivering a seamless and intuitive experience, ensuring easy navigation and access to relevant information and features.
Content Organization: Designed a logical and structured content layout for clear and intuitive access to market news, analysis, and featured articles.
Responsive and Mobile-Friendly: Built a responsive website for optimal viewing across different devices, ensuring seamless access and usability.
Engaging Visual Design: Incorporated appropriate colors, typography, and imagery to create a visually appealing design aligned with the brand identity.
Robust and Scalable Architecture: Developed a strong and scalable website architecture for efficient performance, fast loading, and future growth.

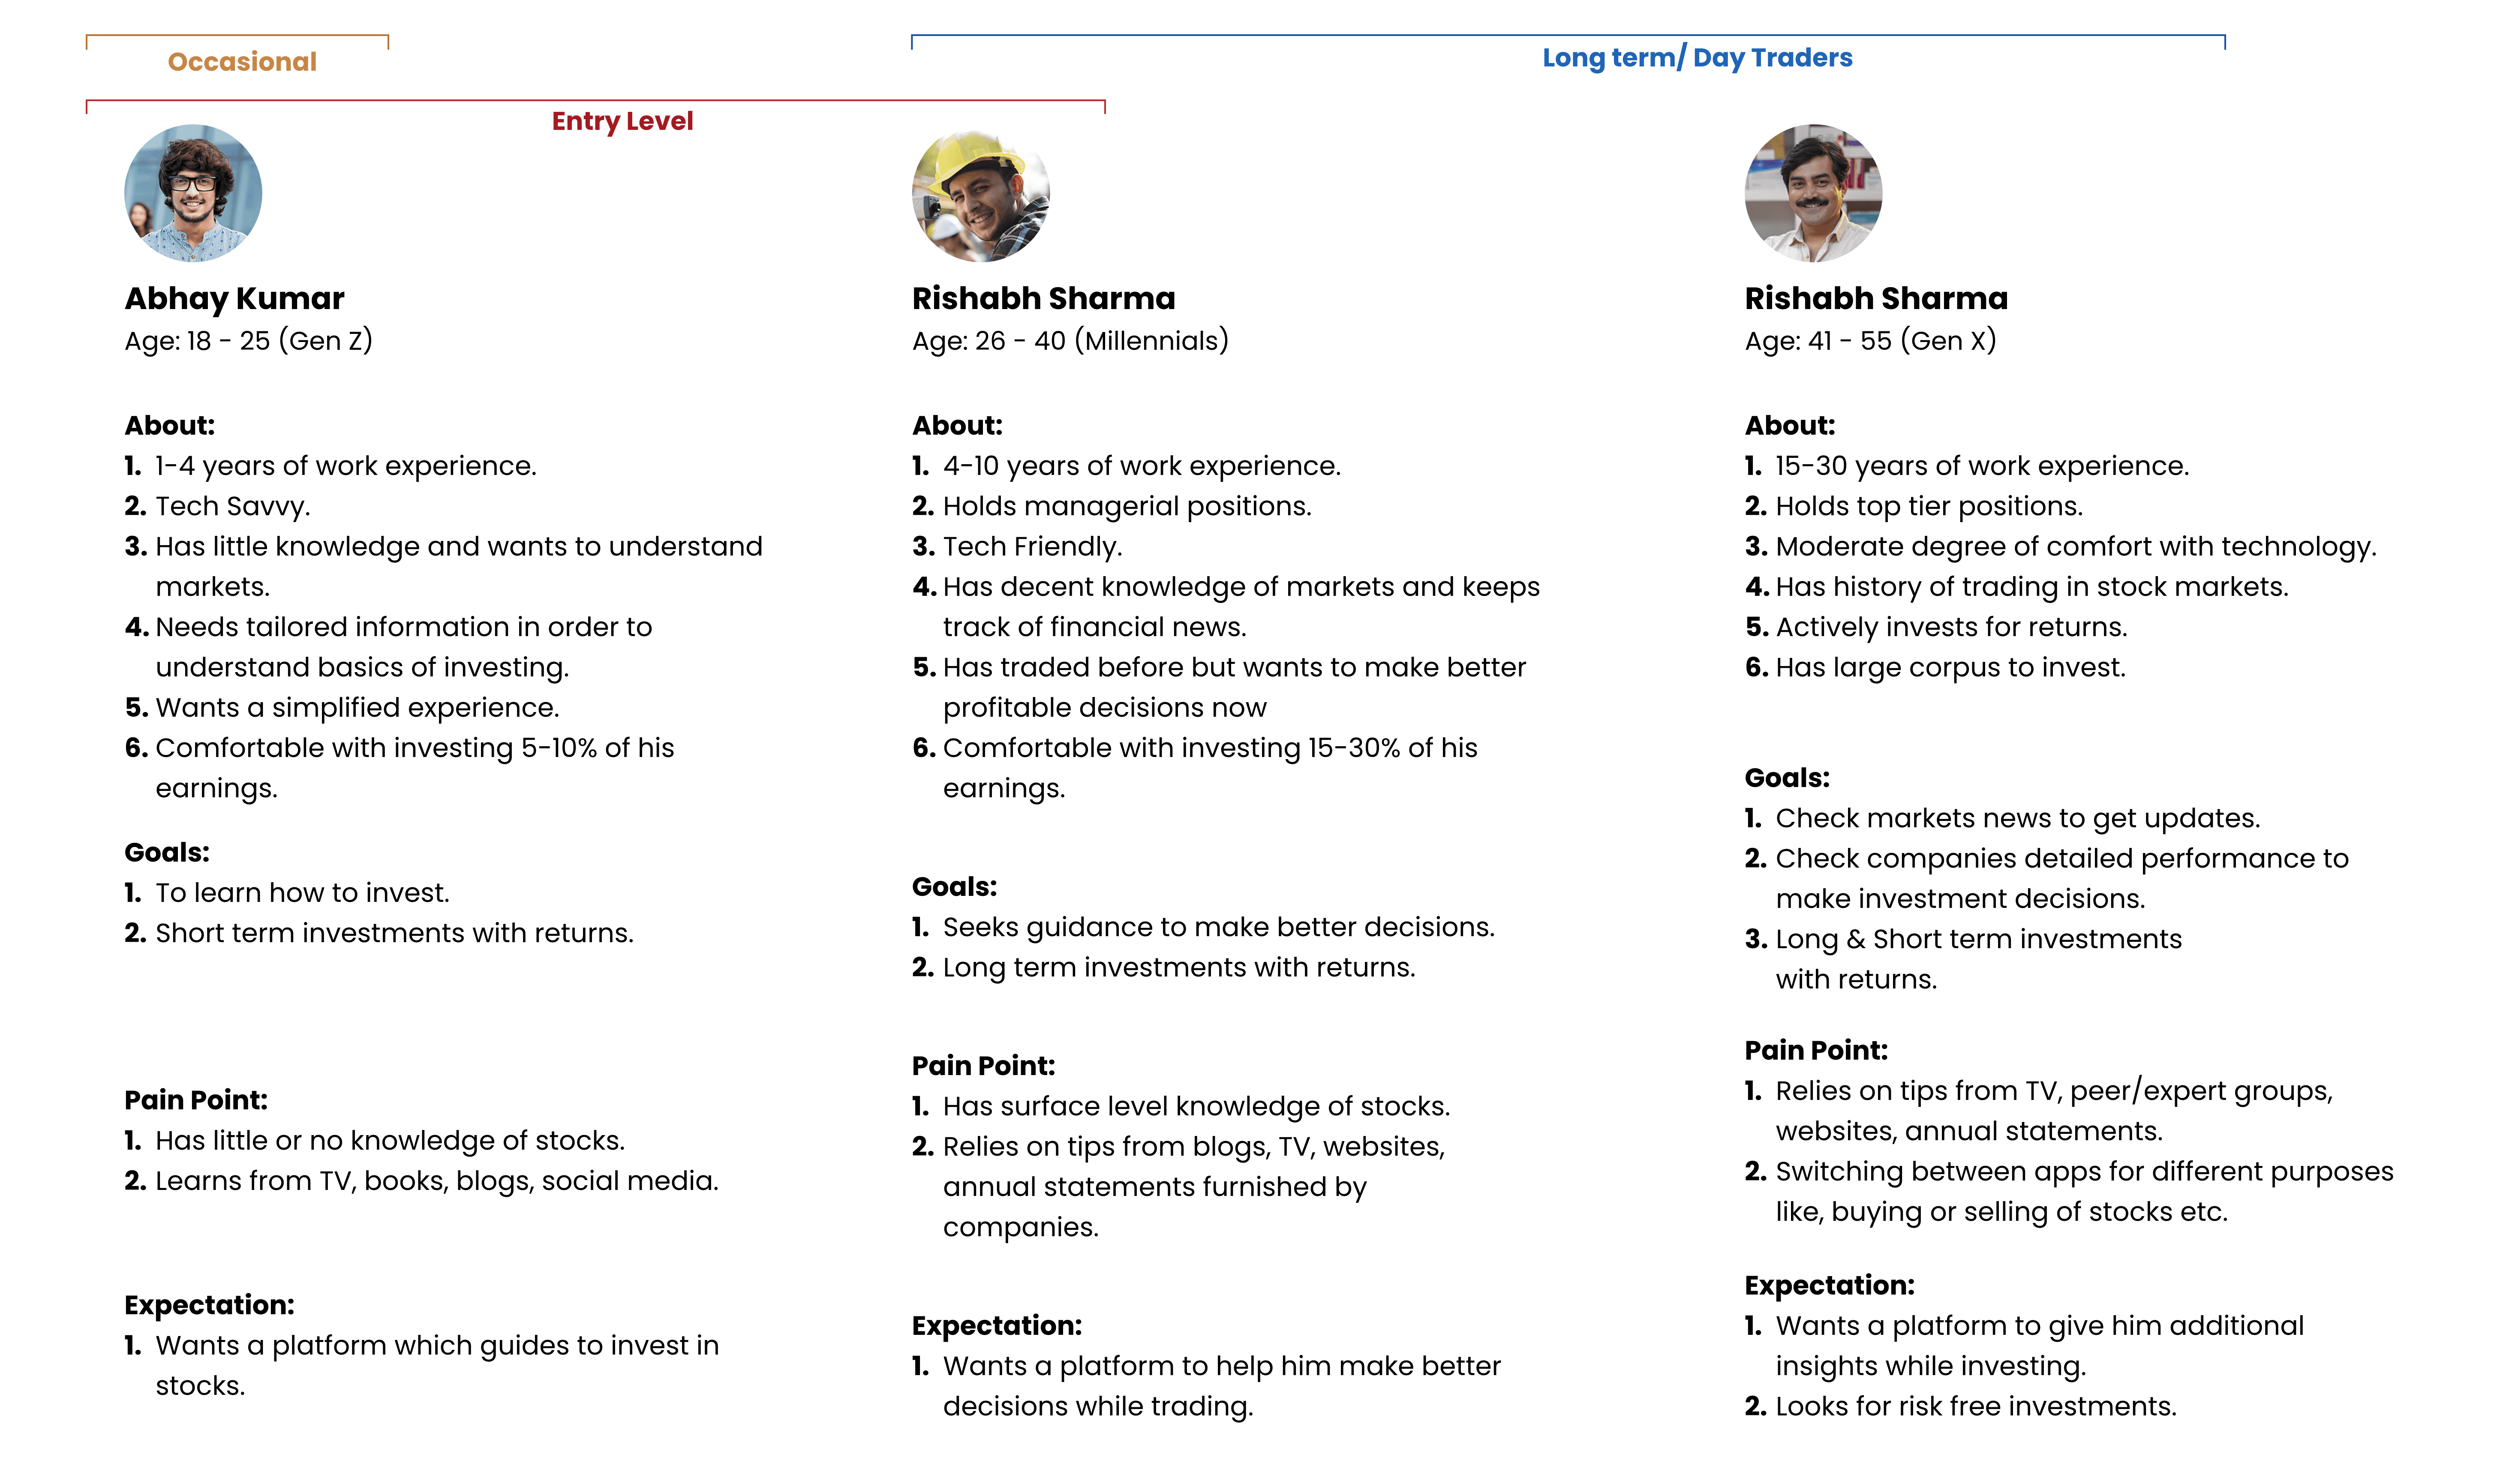
Research:
To gather insights about the target audience and their needs, we conducted user interviews, distributed surveys, and analyzed analytics data. The interviews allowed us to understand the goals, preferences, and pain points of investors, traders, and professionals when accessing financial market information. Surveys provided broader feedback and quantitative data on user preferences and satisfaction levels. Analytics data analysis helped identify usage patterns, popular content, and potential pain points on the existing website. These research methods provided a holistic view of user behaviors, informing our design decisions to create a user-centric and optimized experience for the target audience.
Identified Pain Points and Usability Issues: Through our research phase, we identified several pain points and usability issues that users were facing on the existing website. Some of the key findings include:
Complex Navigation: Users expressed frustration with the website's navigation structure, finding it difficult to locate specific information or sections.
Information Overload: Users felt overwhelmed by the abundance of content and desired a more curated and personalized experience to focus on their specific interests.
Lack of Mobile Optimization: Users accessing the website on mobile devices reported difficulties in navigation and readability due to the non-responsive design.
Limited Interactivity: Users desired more interactive elements such as live charts, social media integration, and comment sections to enhance engagement and community participation.
Poor Readability: Users found the font sizes and typography choices on the website to be small and challenging to read, especially for longer articles.
Wireframes and Rapid Prototypes:
Initially, we created wireframes to outline the website's layout and content placement. These wireframes served as low-fidelity representations of the website's structure, focusing on the placement of key elements, such as the navigation bar, content sections, and interactive features. They provided a visual blueprint for the website's design and allowed us to assess the overall flow and organization of content.
Iterating Based on User Feedback and Usability Testing
To ensure an optimal user experience, we conducted usability testing sessions with a group of representative users. Based on their feedback and insights, we iterated on the wireframes to address usability issues, improve navigation, and enhance the overall user interface. The feedback helped us refine the content placement, simplify navigation pathways, and optimize the visual hierarchy of the website.


Design Choices:
Color Schemes: We chose a color scheme that reflected the professionalism, trustworthiness, and energy associated with the financial market. We opted for a combination of deep blue tones as the primary color, symbolizing stability and reliability, with accents of vibrant colors like orange or green to add a touch of excitement and highlight key elements.
Typography: To ensure readability and convey a sense of sophistication, we selected a clean and modern typography combination. We used a geometric sans-serif font for headings and titles, providing a bold and impactful appearance, while a legible serif font was chosen for body text to enhance readability and create a sense of credibility.
Homepage: The homepage featured a hero section with a captivating image, followed by sections for market news, featured articles, and market analysis. The layout was clean and organized, with distinct sections that allowed for easy navigation and content discovery.
Article Pages: The article pages showcased a clean and focused layout, with attention to typography for optimal readability. Clear headings, subheadings, and body text formatting ensured a pleasant reading experience. Relevant imagery, graphs, or charts were incorporated to enhance the content and engage the users.
Market Analysis Section: This section had a distinctive design to present in-depth market analysis. It included interactive charts, expert insights, and data visualizations to provide comprehensive information for investors and professionals.


My Impact
1. Developed an interactive stock market analysis platform to enable users to easily access and interact with market data.
2. Conducted user research and feedback to design data-driven solutions that resulted in a 25% increase in user engagement and a 20% improvement in user satisfaction.
3. Created interactive charts and graphs and user-friendly navigation to enhance user experience.
4. Applied data-driven approach to ensure user-friendliness, efficiency, and valuable insights for investors and traders

Learnings
1. User research is crucial: This underscores the importance of taking the time to understand your target audience's needs and preferences before developing a product.
2. User engagement and satisfaction are key metrics: These metrics should be considered when developing any product or service, as they are strong indicators of the value that the product provides to users.
3. User experience is a competitive advantage: In today's market, user experience is a key differentiator, and creating an enjoyable and intuitive user interface can make or break a product's success.
4. Data-driven approaches lead to better outcomes: This underscores the importance of using data to inform product development and design decisions, as it can lead to more effective and impactful solutions.
Other Projects

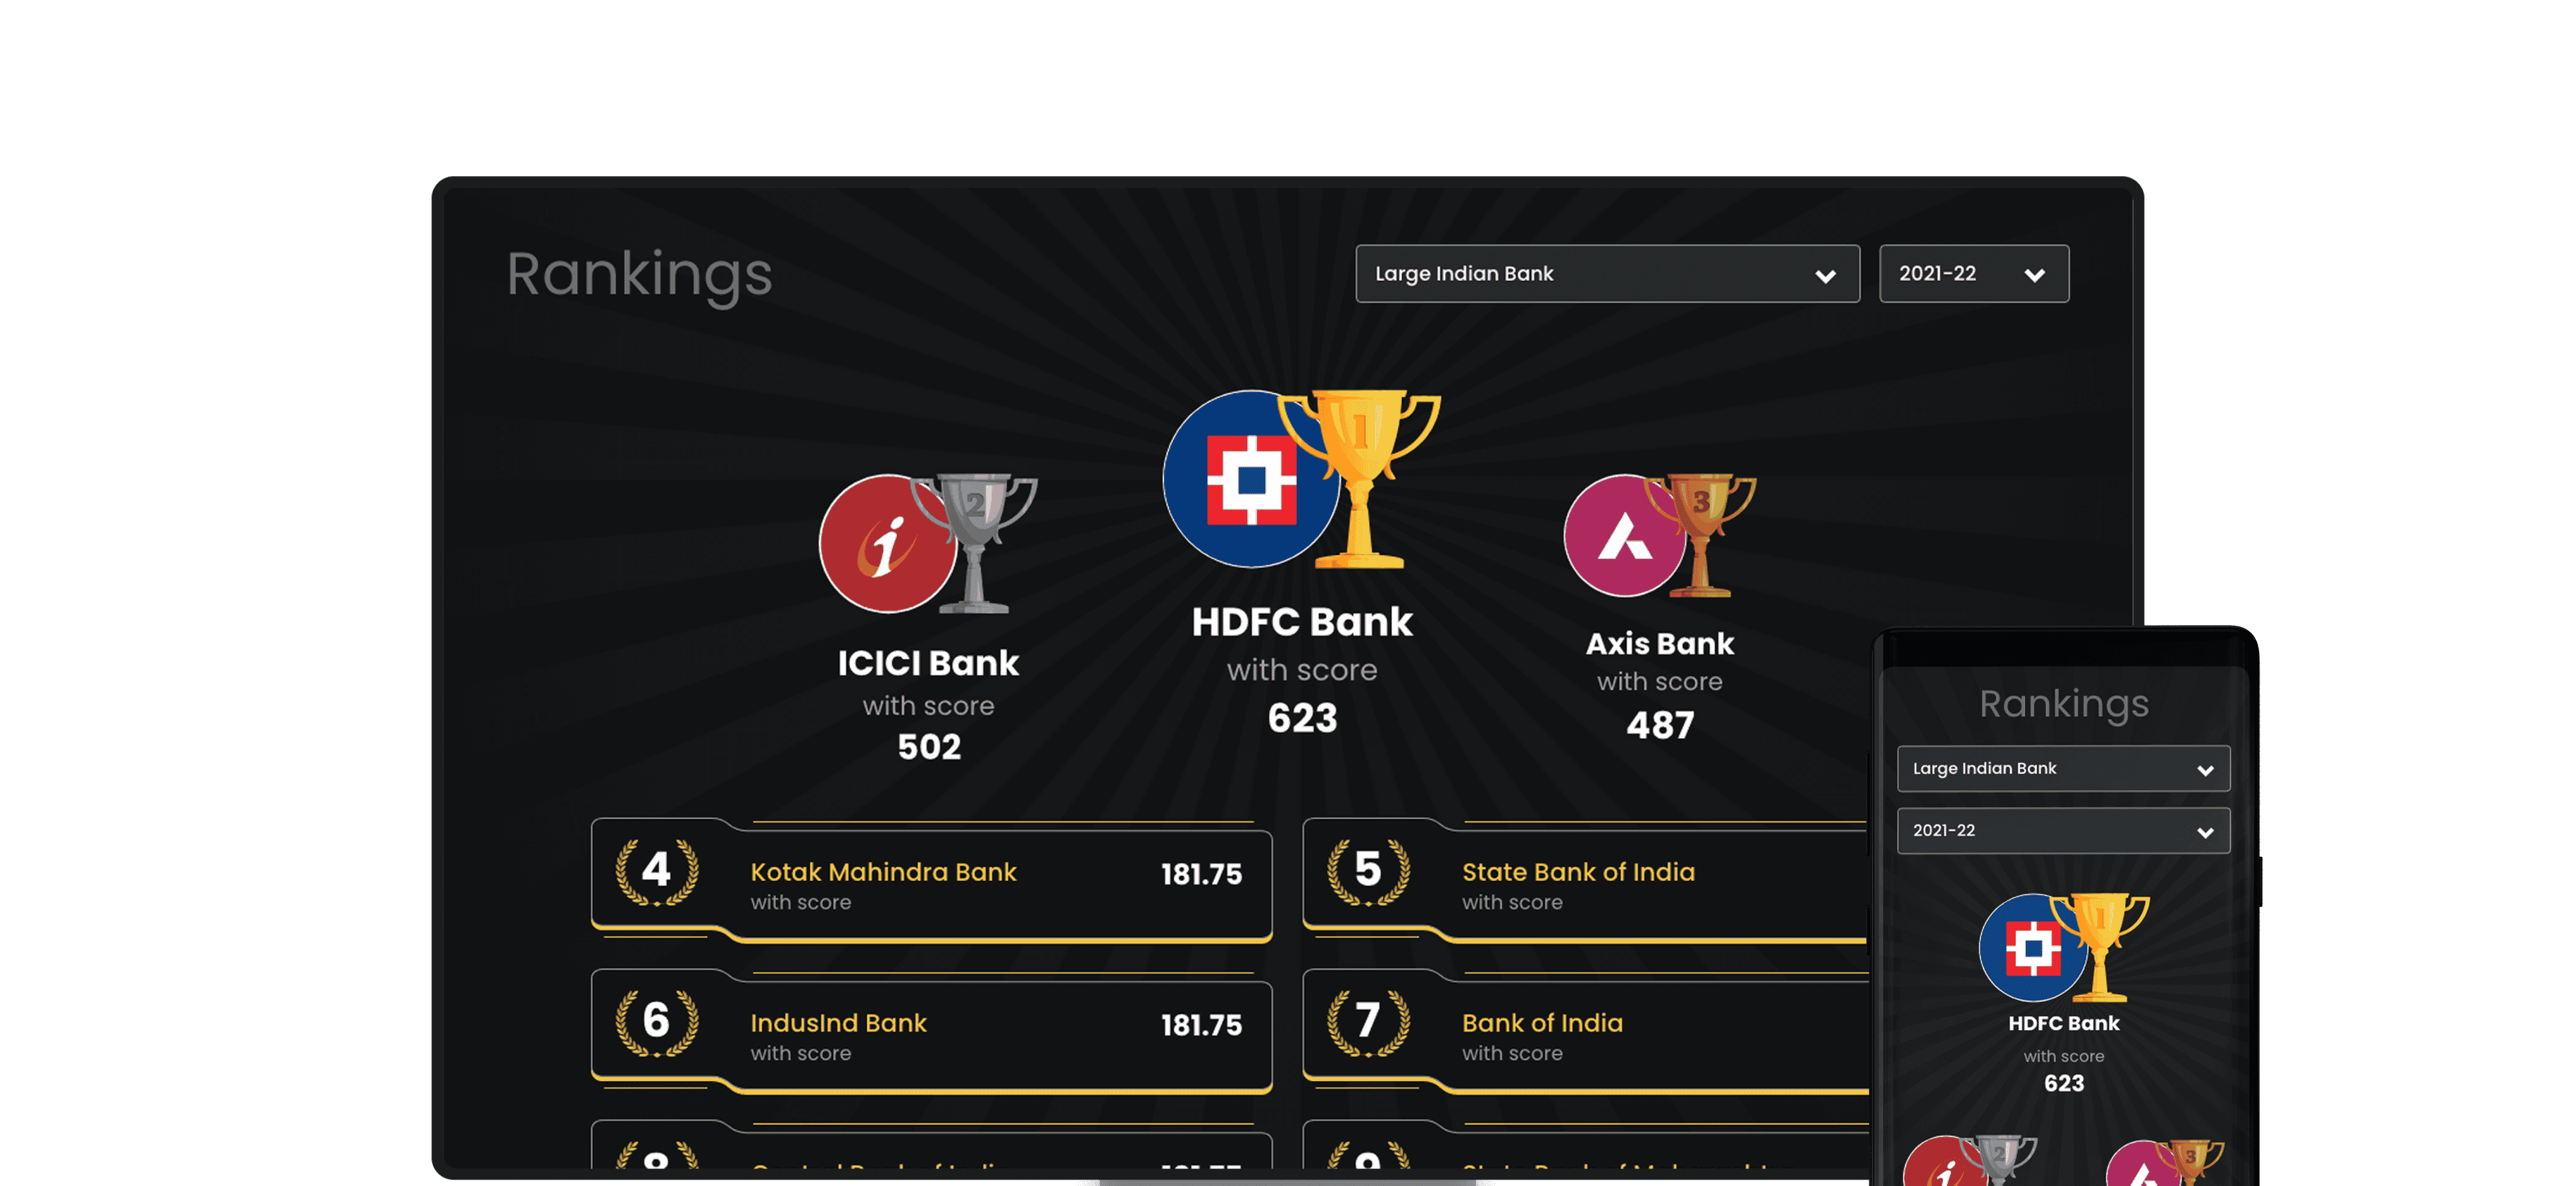
Best Banks Comparison
UI/UX Design, Data Design, Web, Mobile, Analytics