
UI/UX
Data Design
Web
Mobile
Analytics
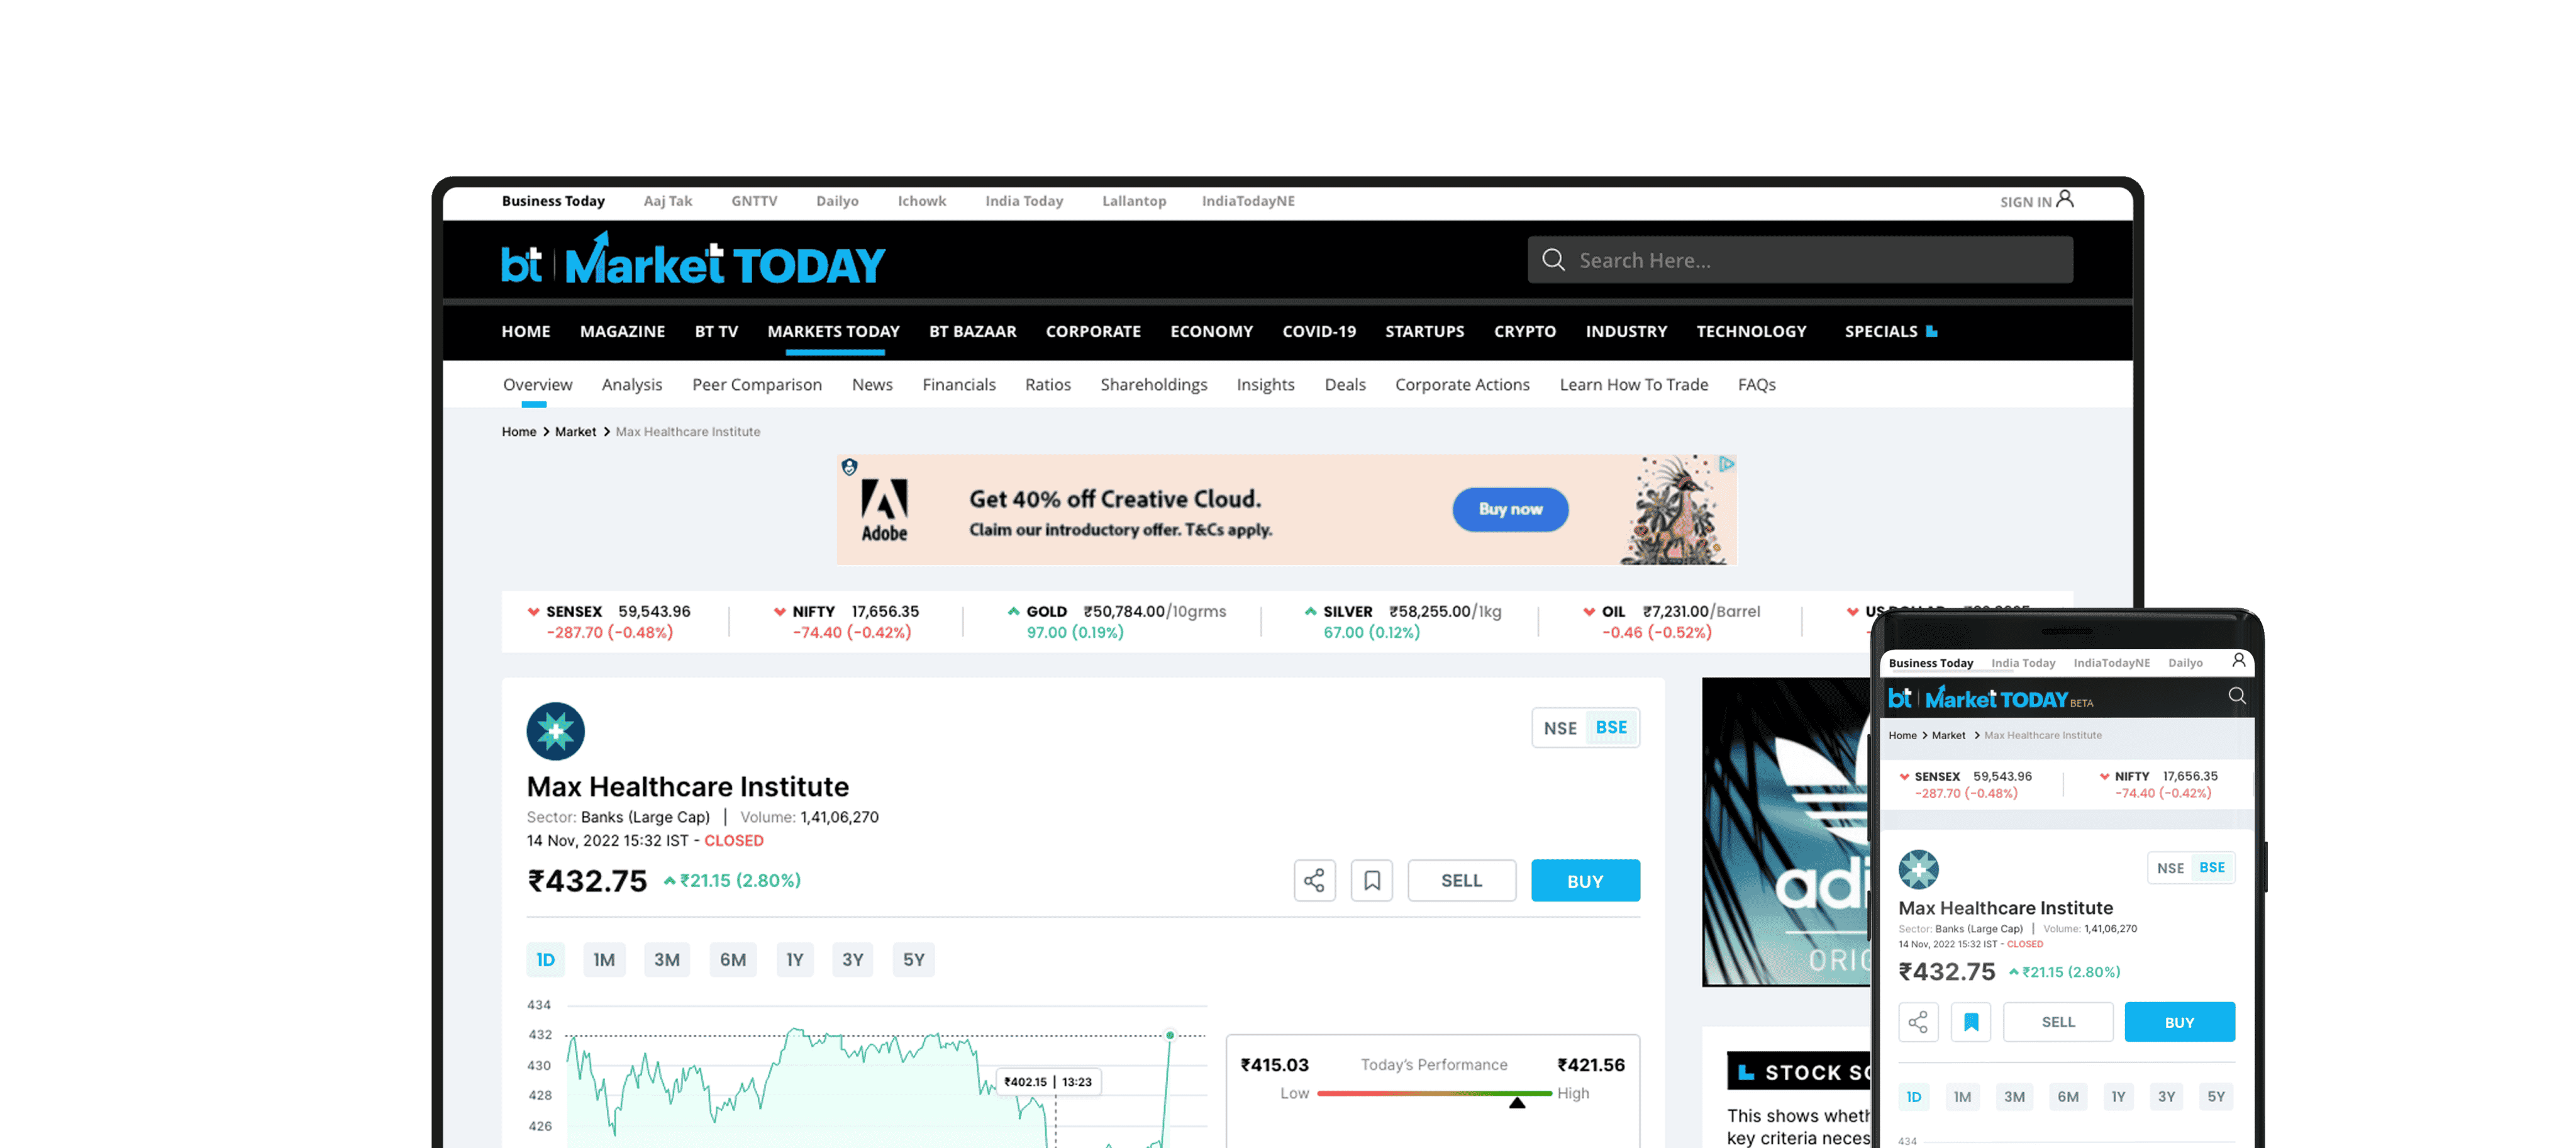
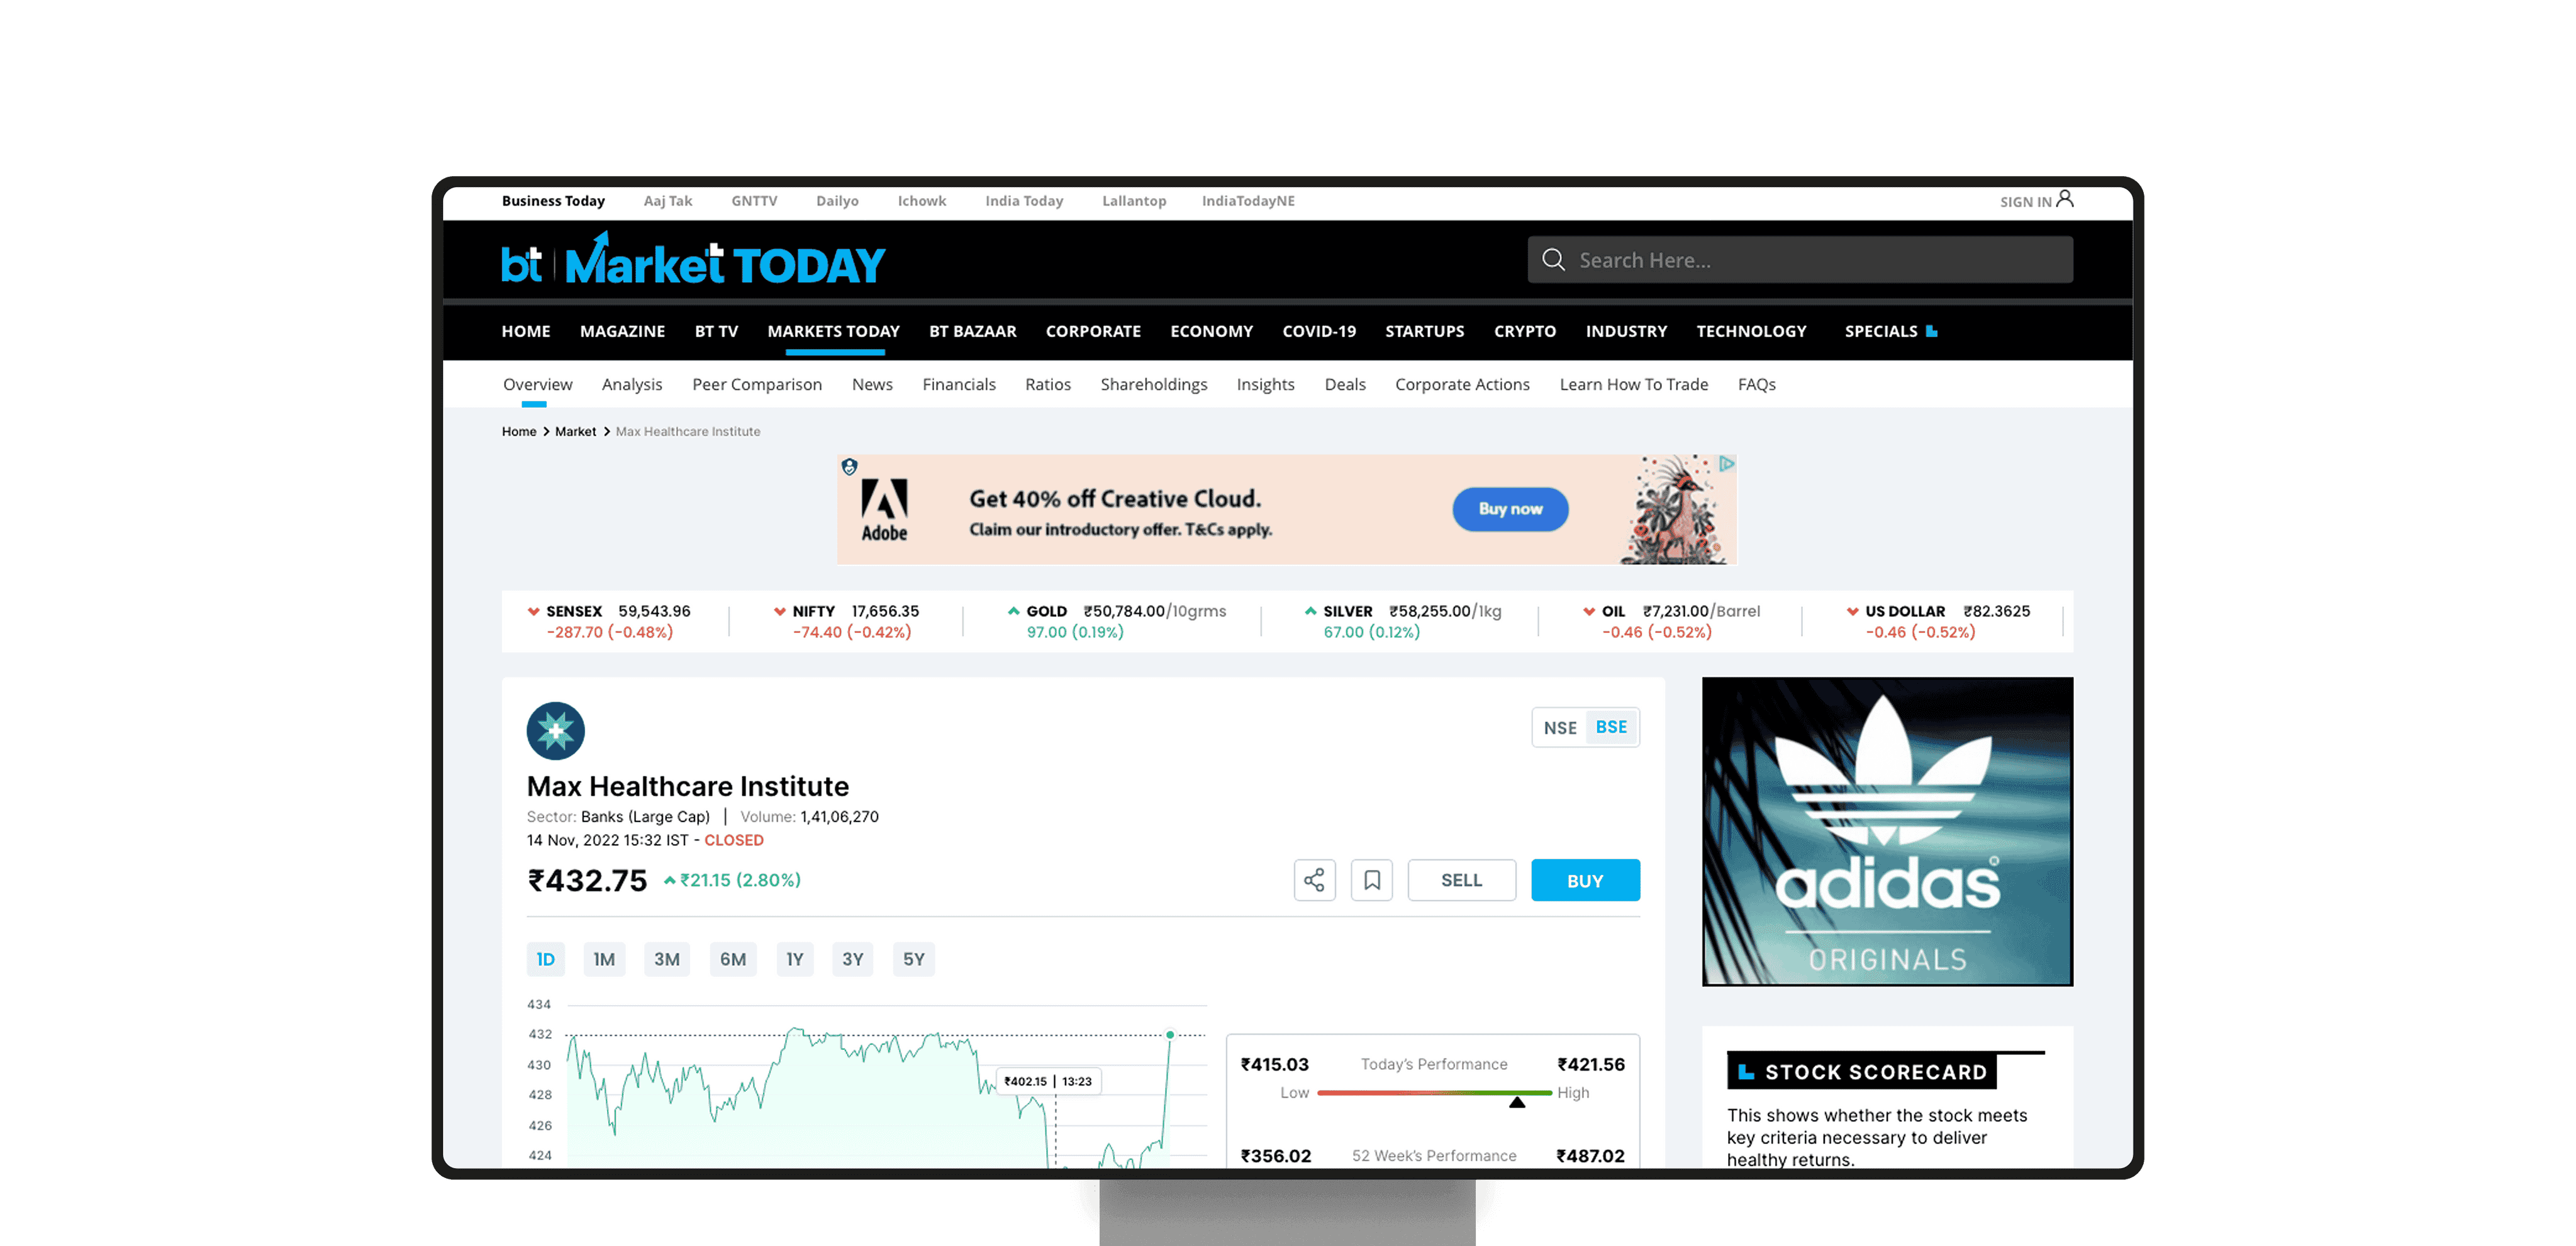
Company Stock Page
Intro
The primary purpose of the tool is to offer a comprehensive resource for investors, traders, and individuals interested in monitoring the performance of different stocks. By presenting up-to-date data, charts, and news related to various companies' stocks, the website aims to empower users with valuable information for making informed investment decisions.
Duration
10 weeks, 2022
Role
I worked as a UX & Data Designer, collaborating closely with the Project Leads, BA's and team of developers.
Goals and Objectives:
Robust Data Integration: The tool aims to seamlessly integrate with reliable data sources to ensure accurate and up-to-date stock information. The objective is to provide users with real-time data and enable them to monitor stock prices with precision.
Intuitive User Interface: The development process focuses on creating an intuitive and user-friendly interface that allows users to navigate effortlessly and access desired information with ease. The objective is to provide a smooth and engaging user experience.
Customizability and Personalization: The tool aims to offer customization options to users, allowing them to personalize their stock portfolios, set preferences, and receive tailored alerts and notifications. The objective is to provide a personalized experience that aligns with individual user requirements.
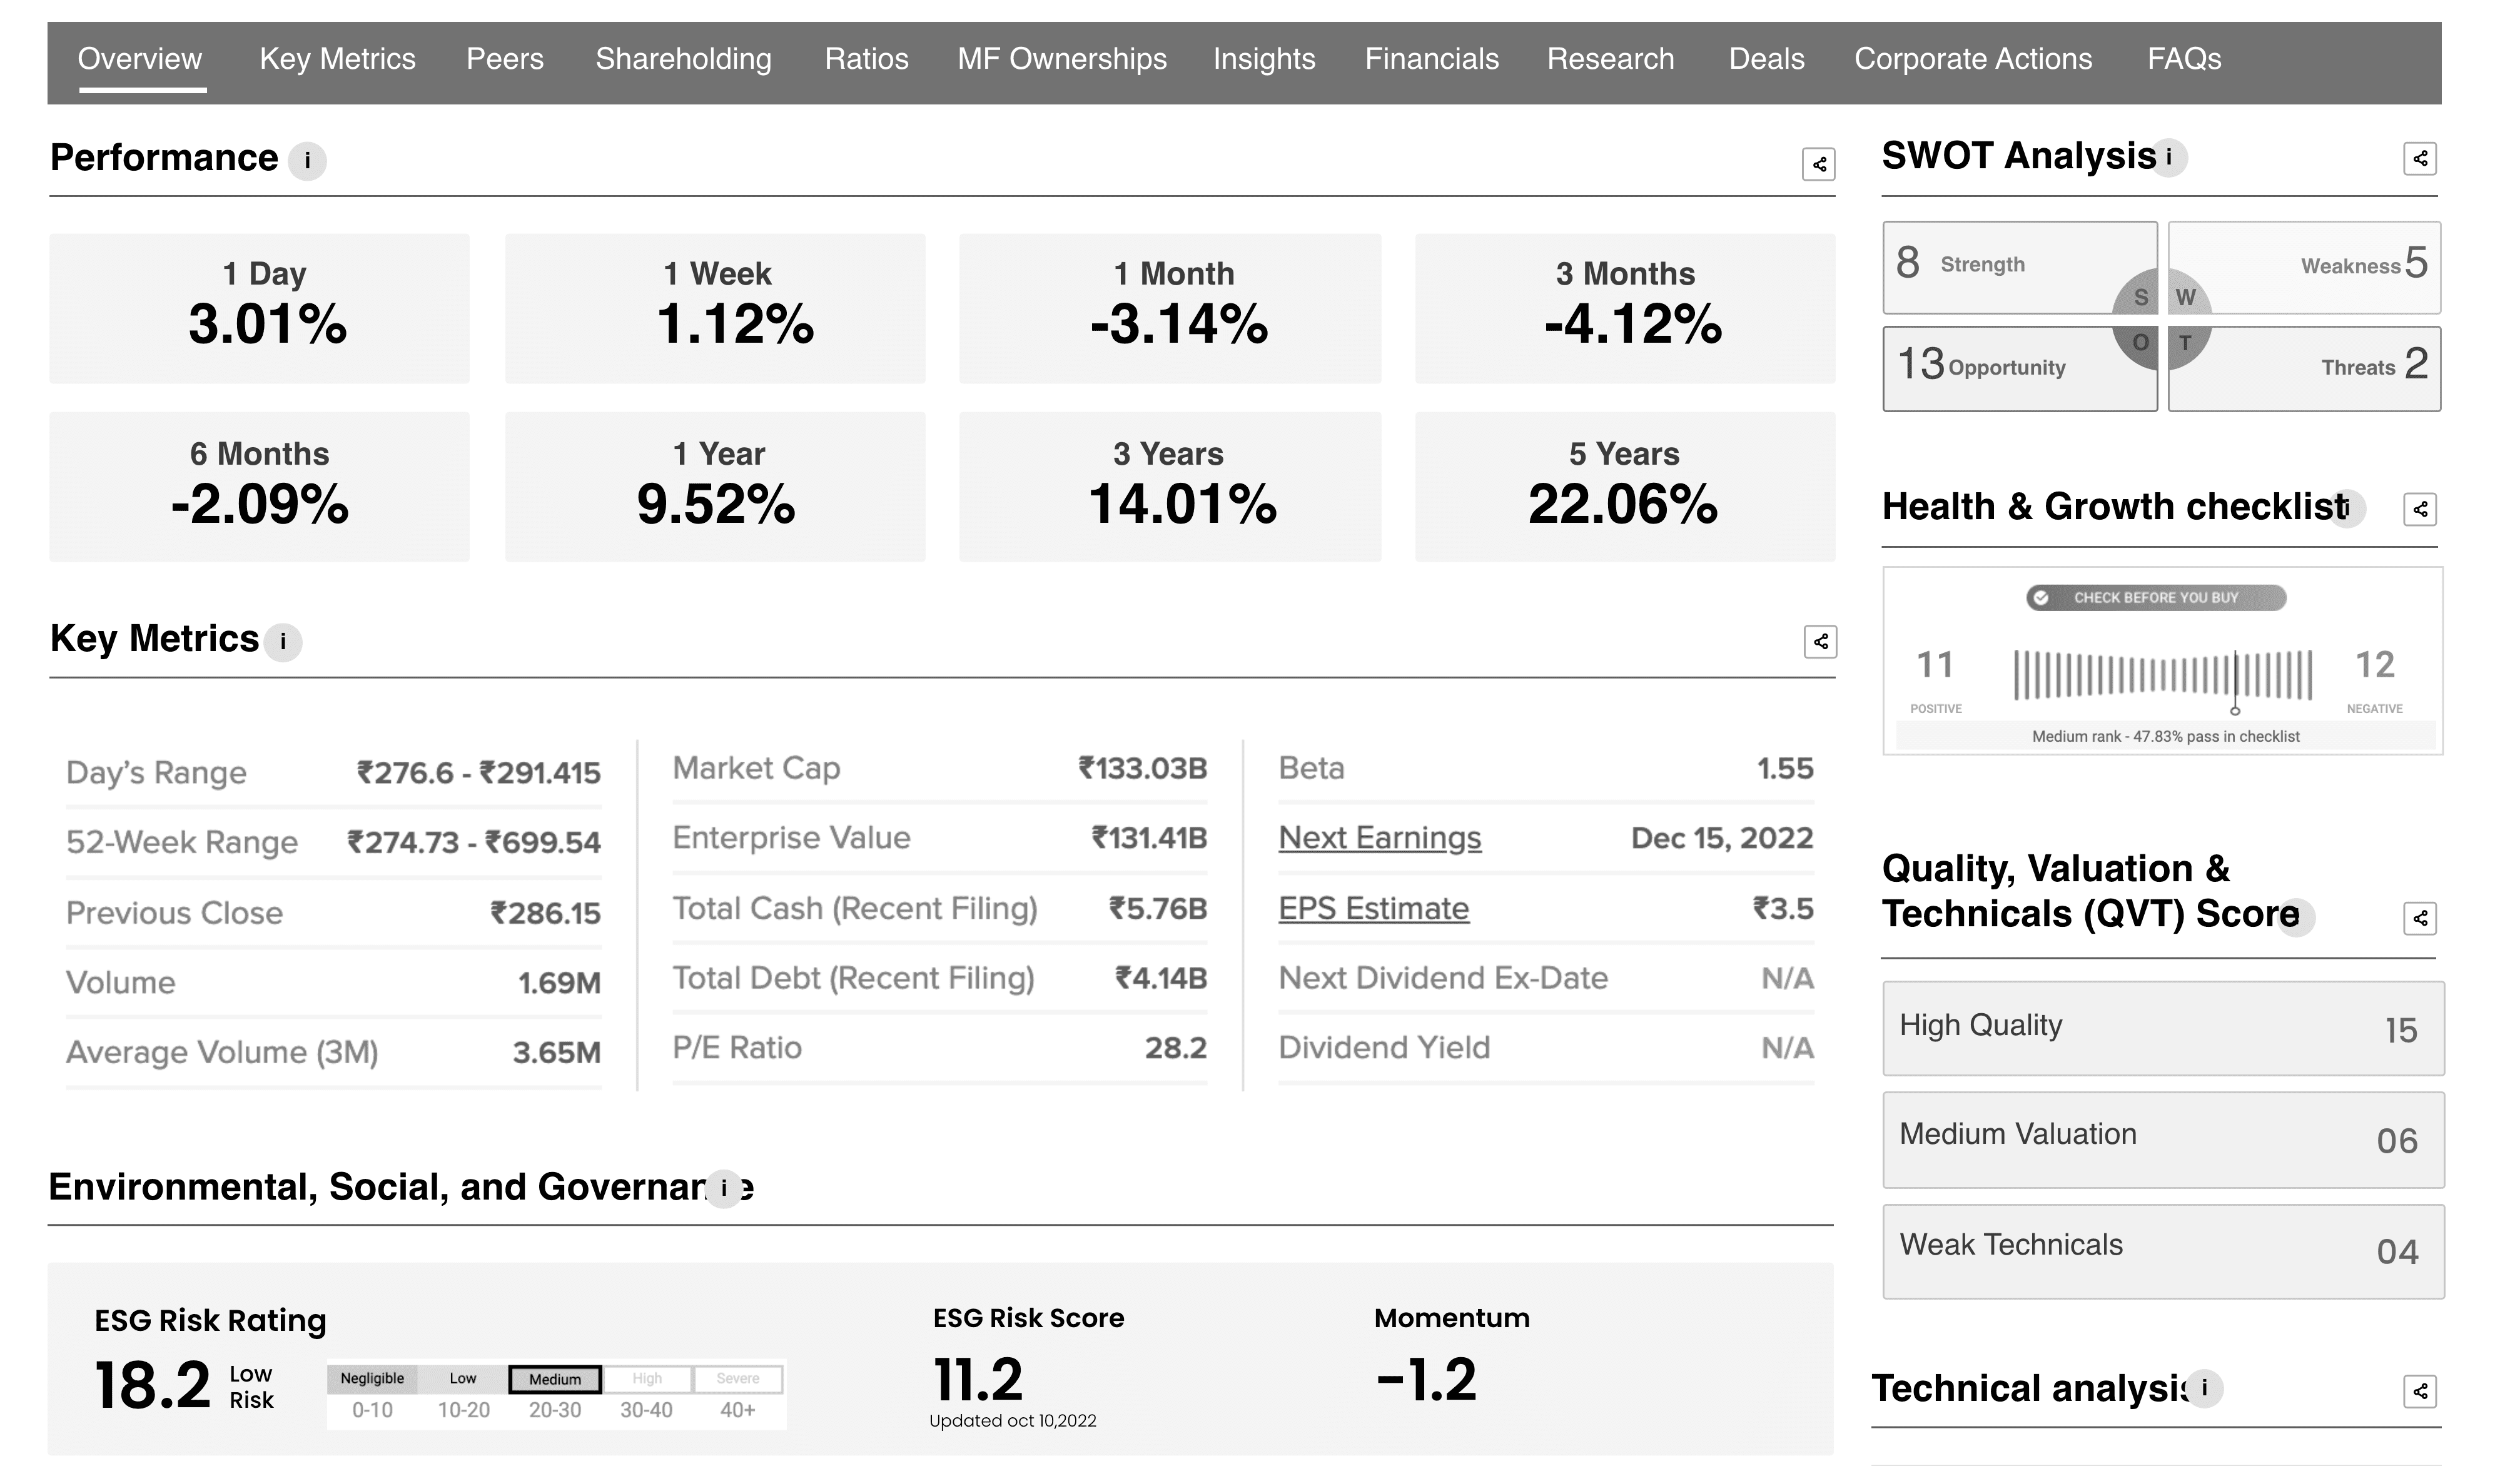
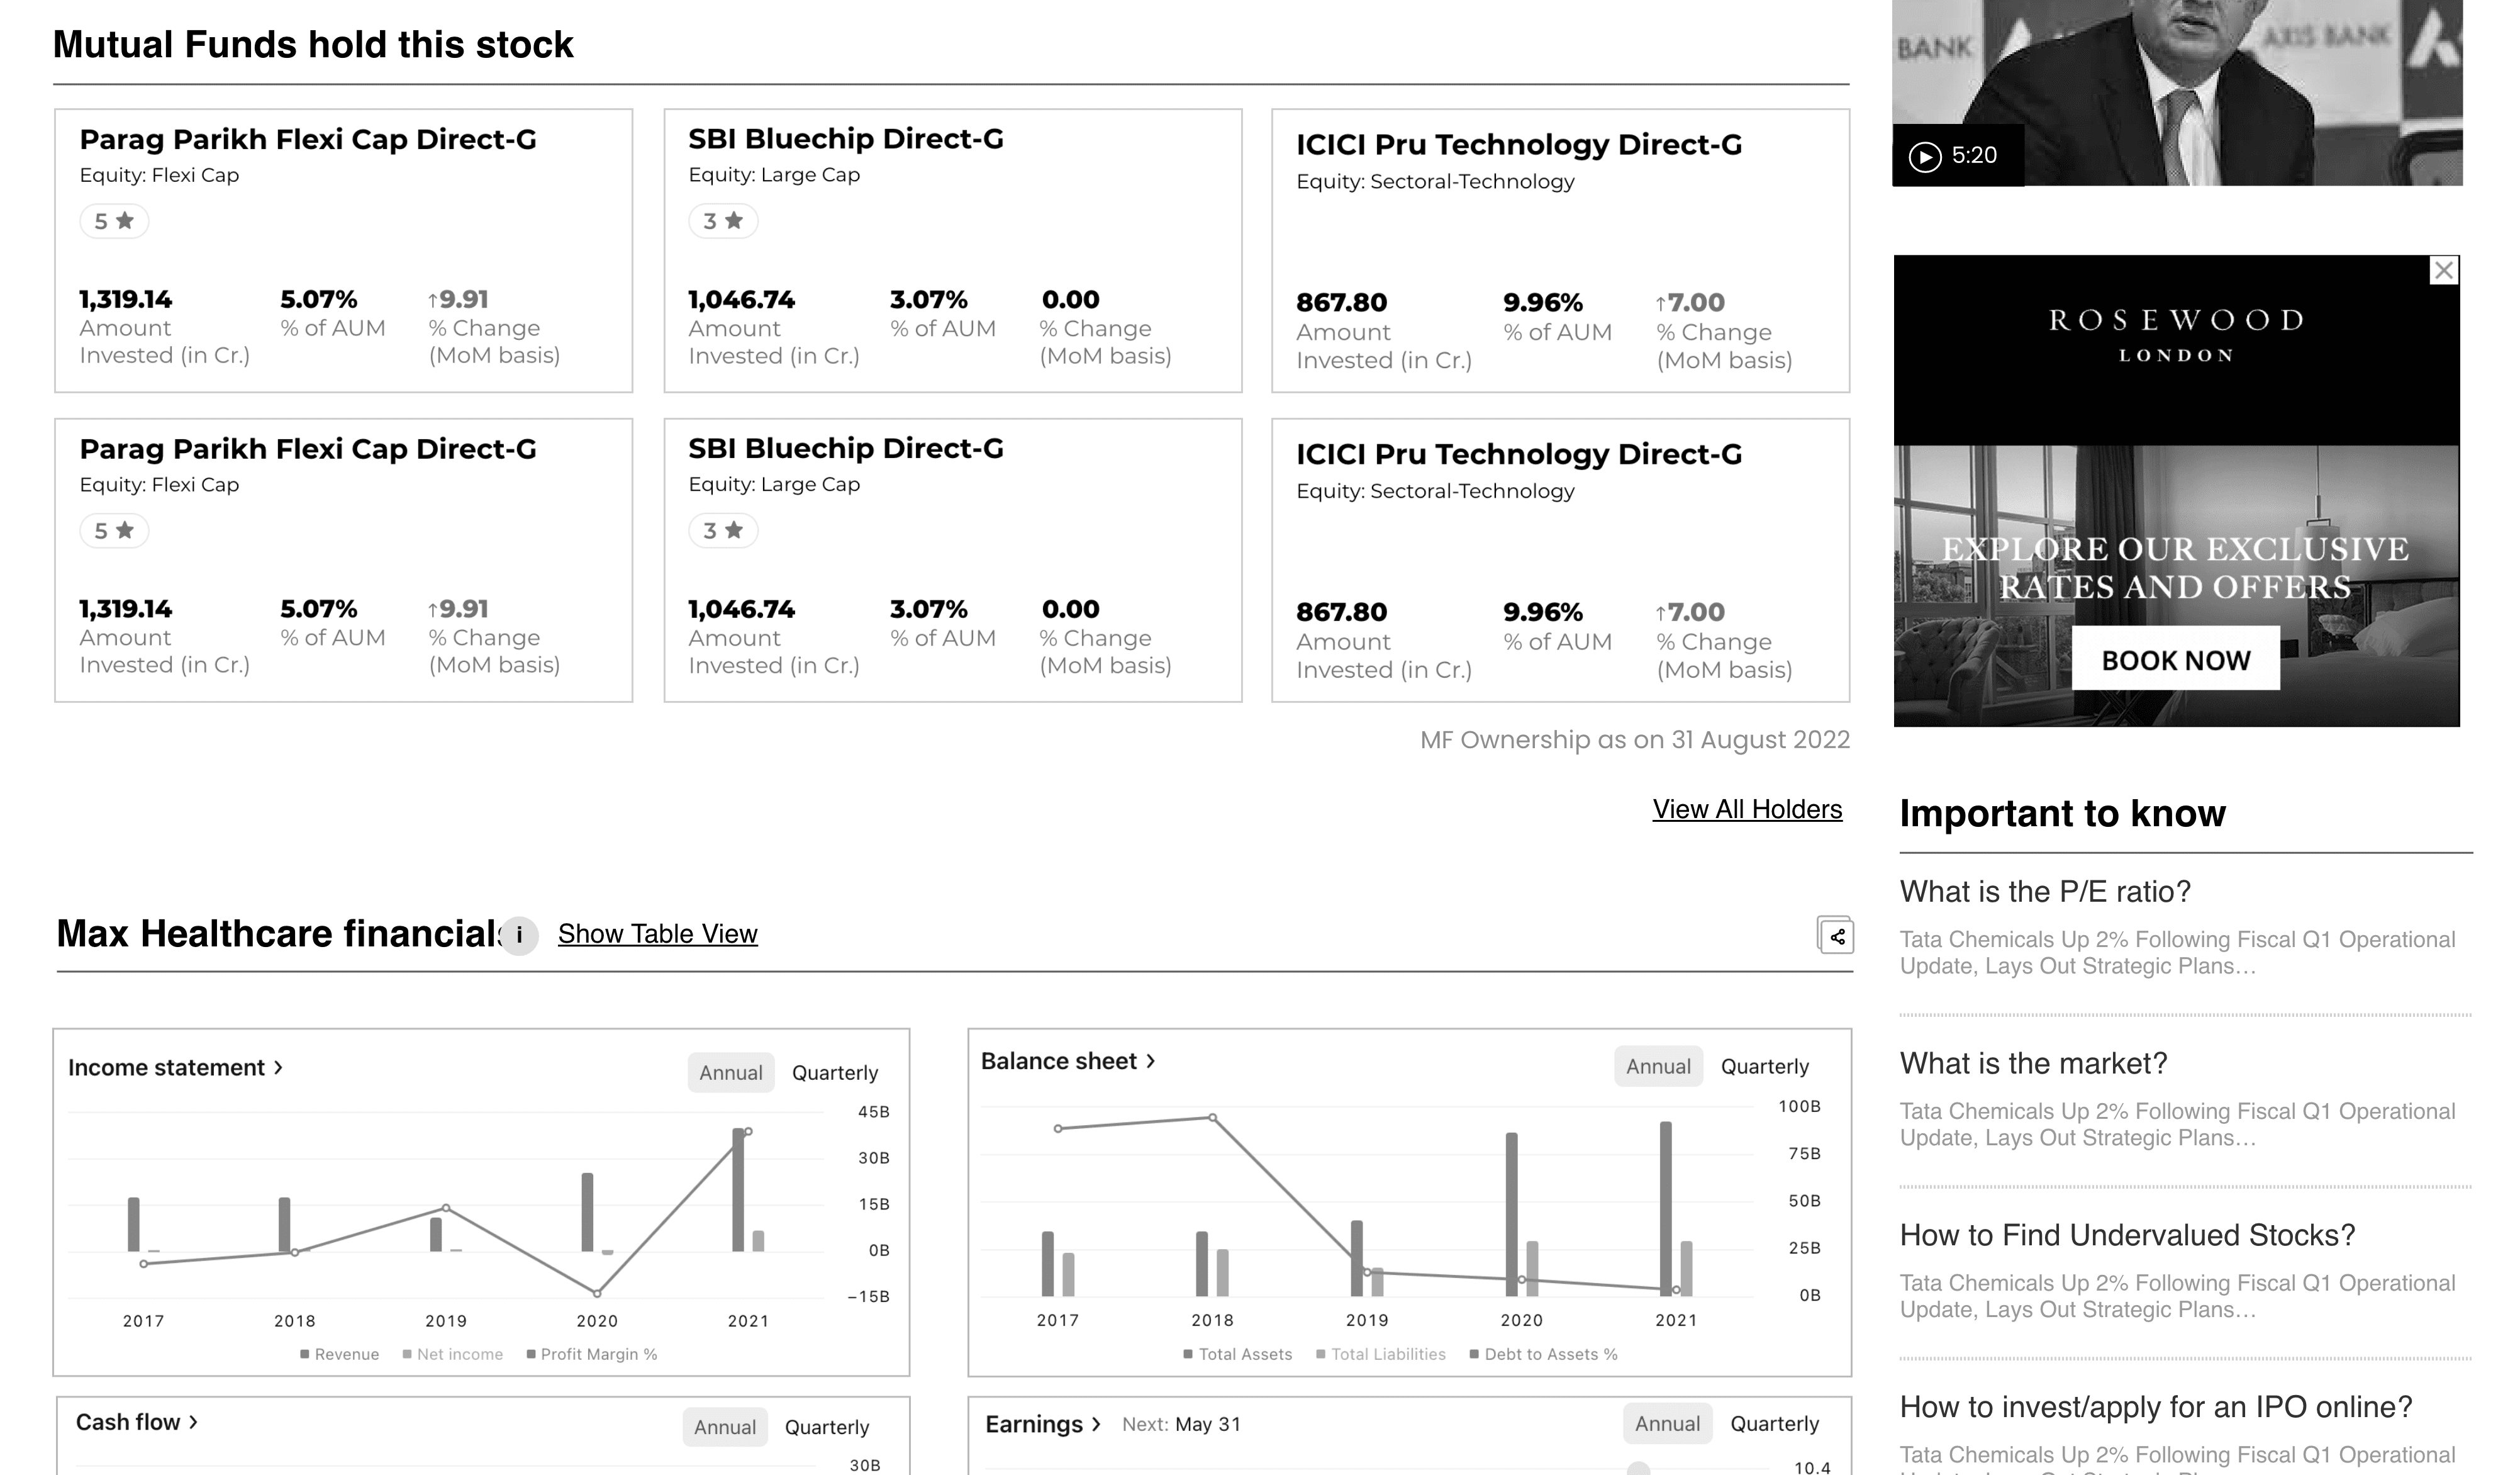
Analytical Tools and Insights: The tool seeks to provide users with analytical tools, such as charts, graphs, and performance indicators, to facilitate in-depth analysis of stock trends and patterns. The objective is to empower users with the necessary tools for making informed investment decisions.
Performance and Reliability: The development process focuses on ensuring optimal performance and reliability of the tool. This includes implementing efficient coding practices, robust infrastructure, and thorough testing to provide a stable and dependable platform.
Pain Points:
Limited Tools for Stock Comparison: Users expressed a need for more comprehensive tools that allow for easy comparison of multiple stocks, including performance indicators, historical data, and fundamental metrics.
Lack of Suggested Stocks Based on Goals: Users desired a feature that could provide personalized stock recommendations aligned with their investment goals, risk tolerance, and time horizon. The absence of such a feature made it challenging for users to identify suitable investment opportunities.
Insufficient Chart Options: Users expressed a desire for a wider range of chart options, such as candlestick charts, technical indicators, and customizable charting tools. The availability of diverse charting options was seen as crucial for conducting thorough technical analysis.
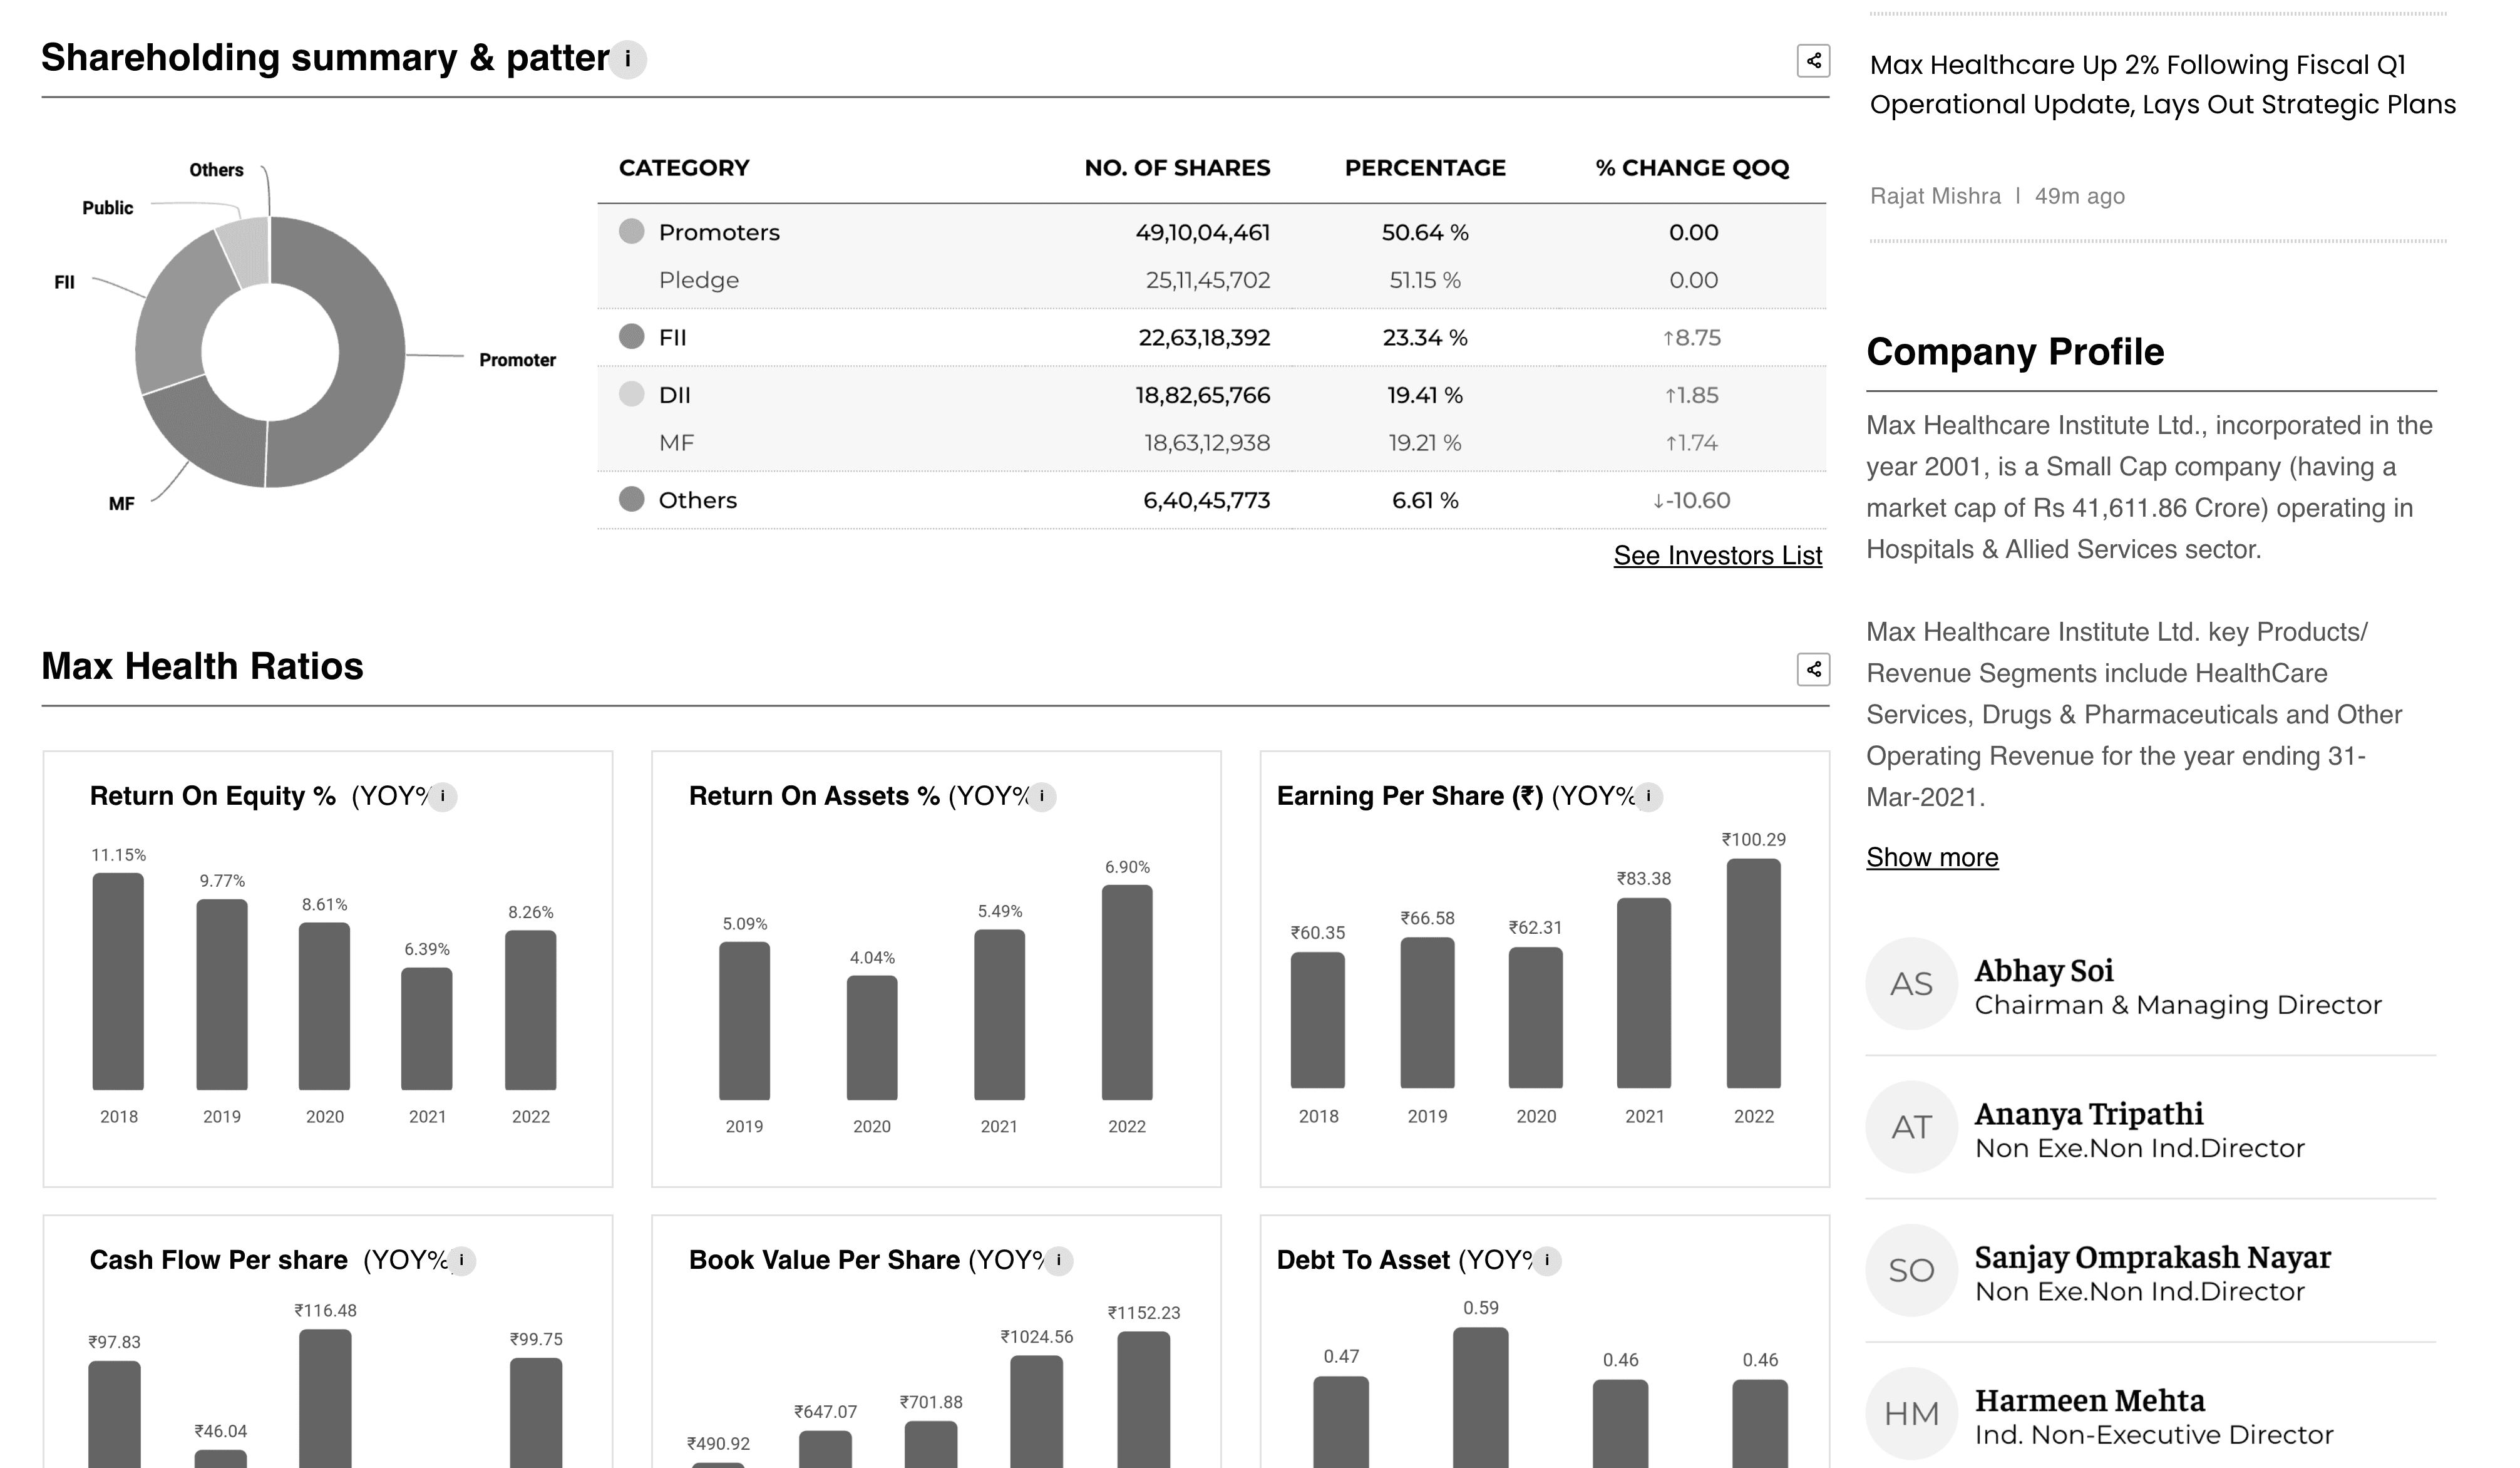
Limited Ratios Comparisons: Users highlighted the importance of comparing key financial ratios of different stocks for evaluating their financial health and performance. The lack of comprehensive ratio comparisons made it challenging to conduct thorough fundamental analysis.
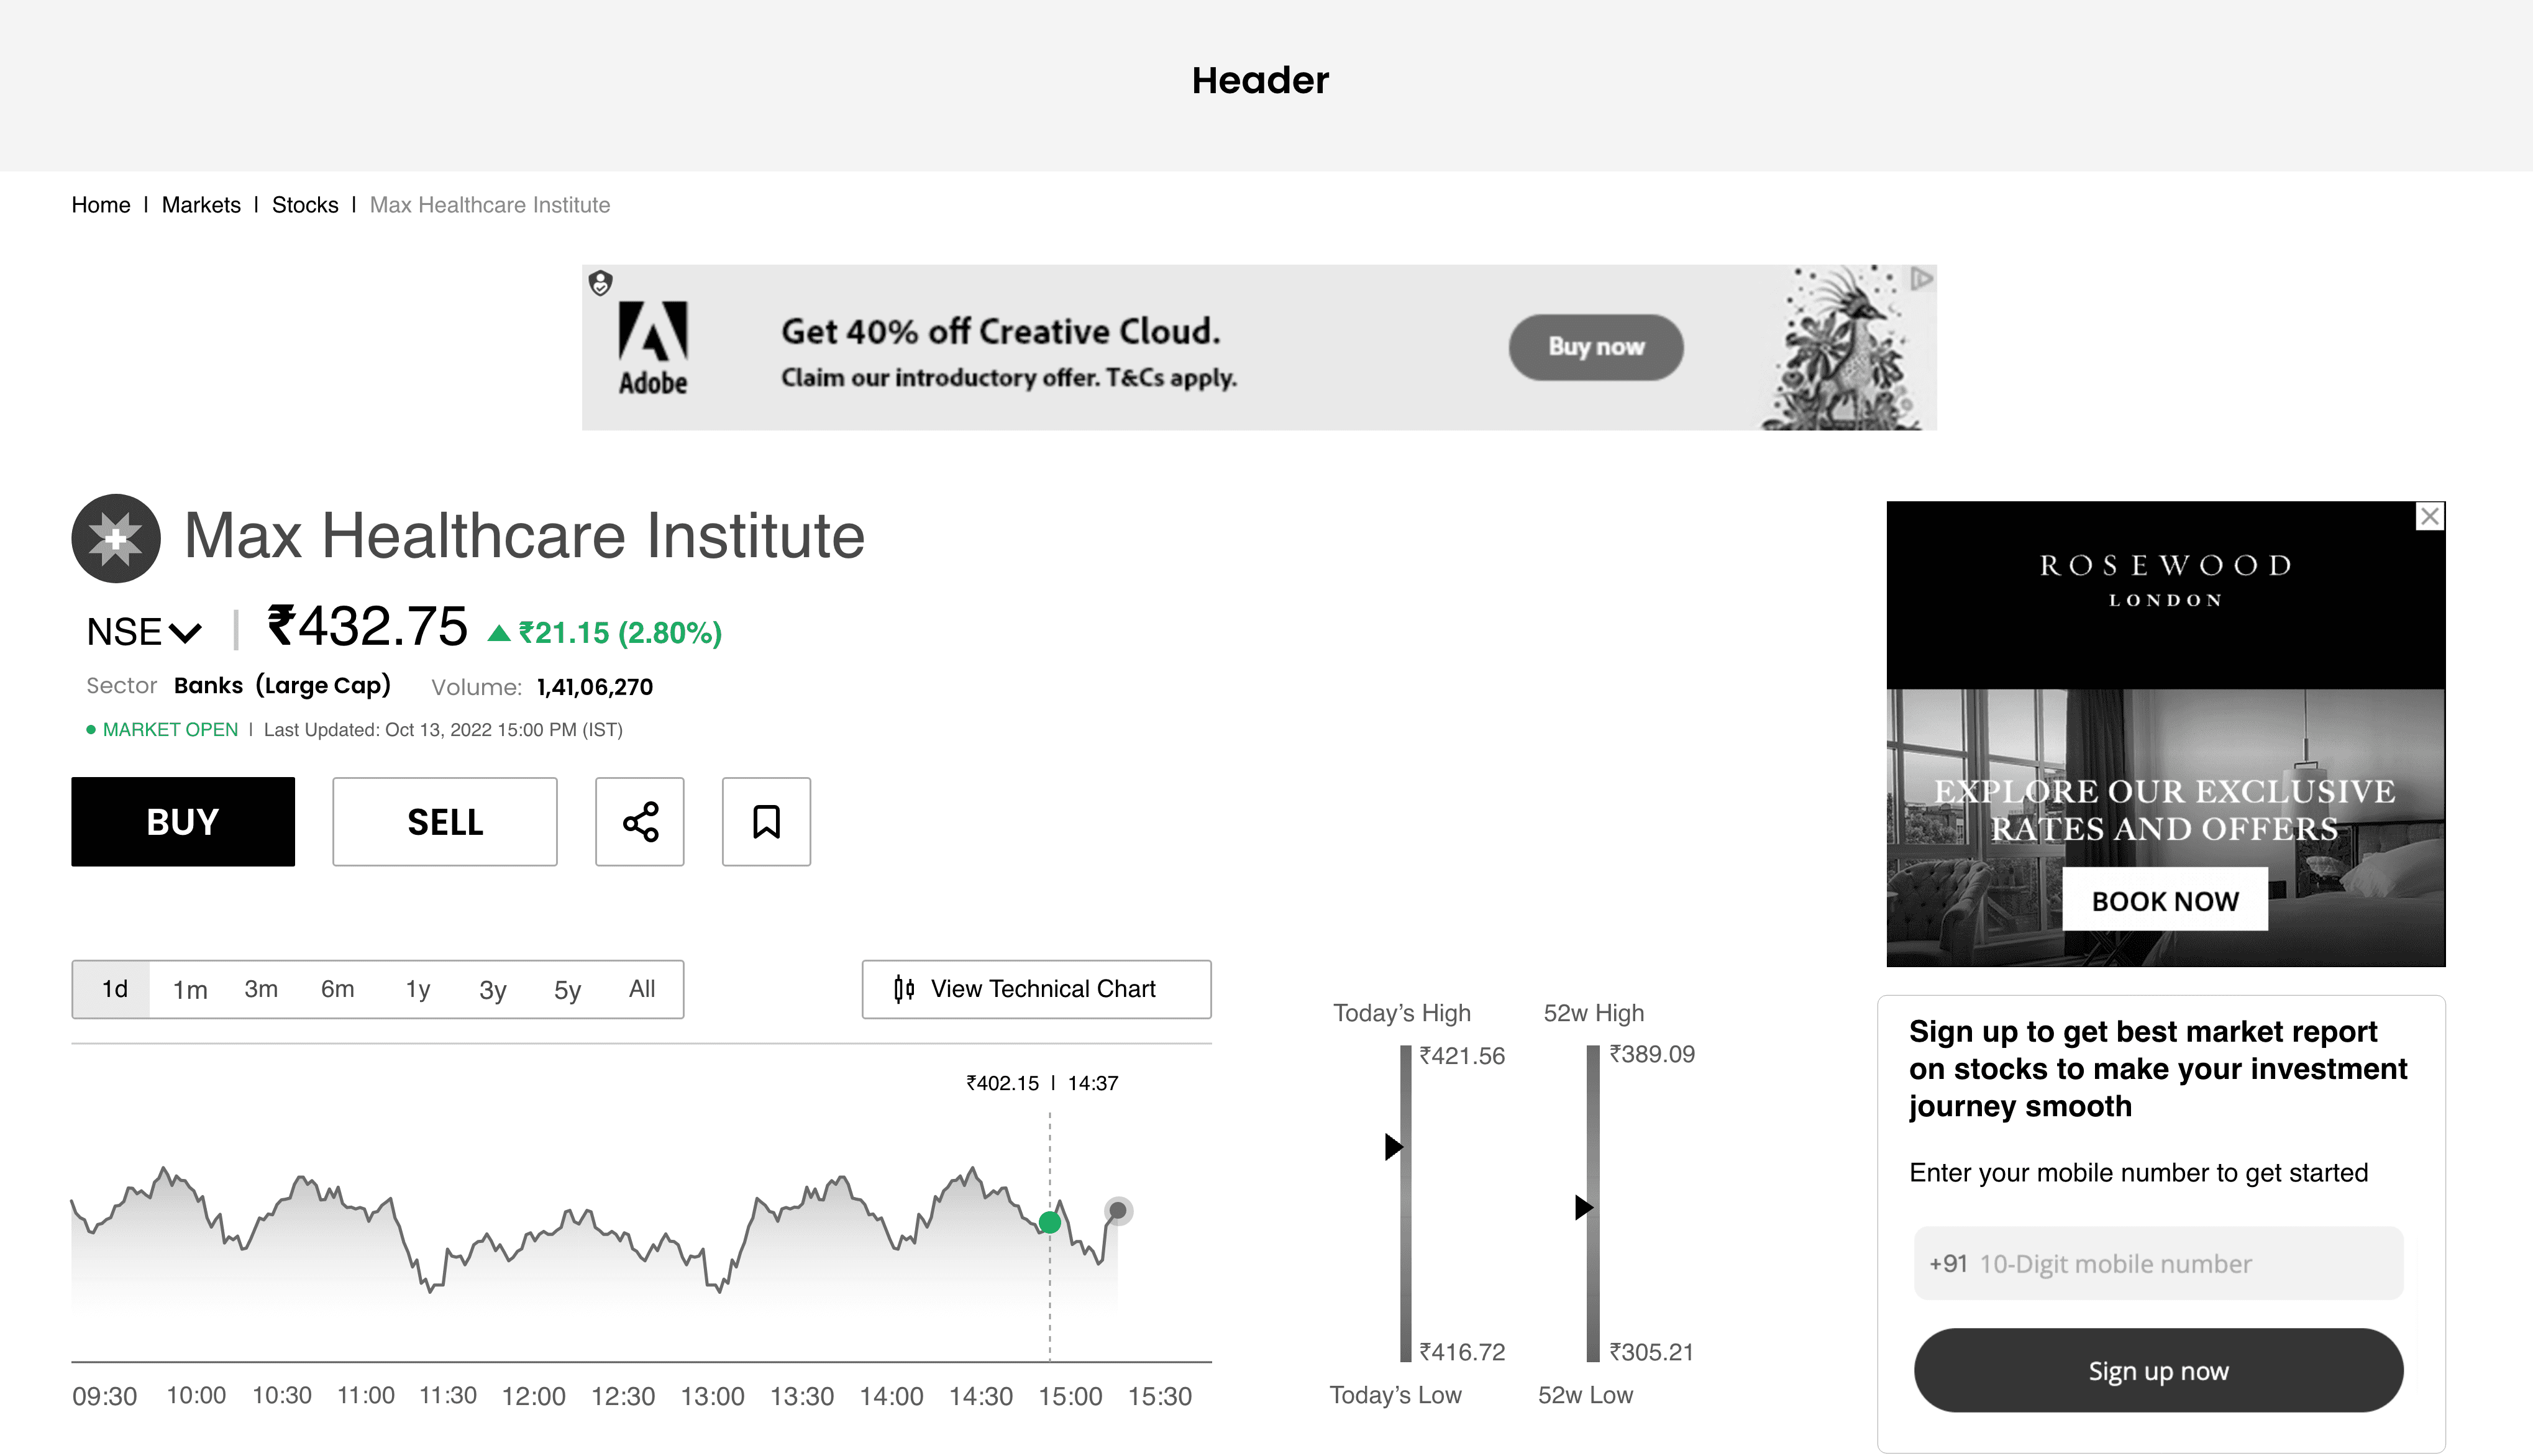
Wireframes and Rapid Prototypes:
Initially, we created wireframes to outline the website's layout and content placement. These wireframes served as low-fidelity representations of the website's structure, focusing on the placement of key elements, such as the navigation bar, content sections, and interactive features. They provided a visual blueprint for the website's design and allowed us to assess the overall flow and organization of content.
Learnings
1. Agile and Iterative Methodologies: Embracing agile methodologies, such as Scrum or Kanban, to facilitate an iterative design and development process. Regularly testing and iterating on the product based on user feedback and analytics data would allow for continuous improvement and rapid adaptation to evolving user requirements.
2. Metrics-Driven Decision Making: Implementing robust analytics tools and tracking key metrics to gain insights into user behavior, engagement, and conversion rates. Data-driven decision making would enable evidence-based improvements and optimizations to enhance the user experience and achieve desired project goals.
3. Continuous Improvement and Support: Emphasizing the importance of continuous improvement post-launch. Monitoring user feedback, addressing issues promptly, and providing ongoing support and updates to enhance the tool's functionality and address emerging user needs.

Other Projects

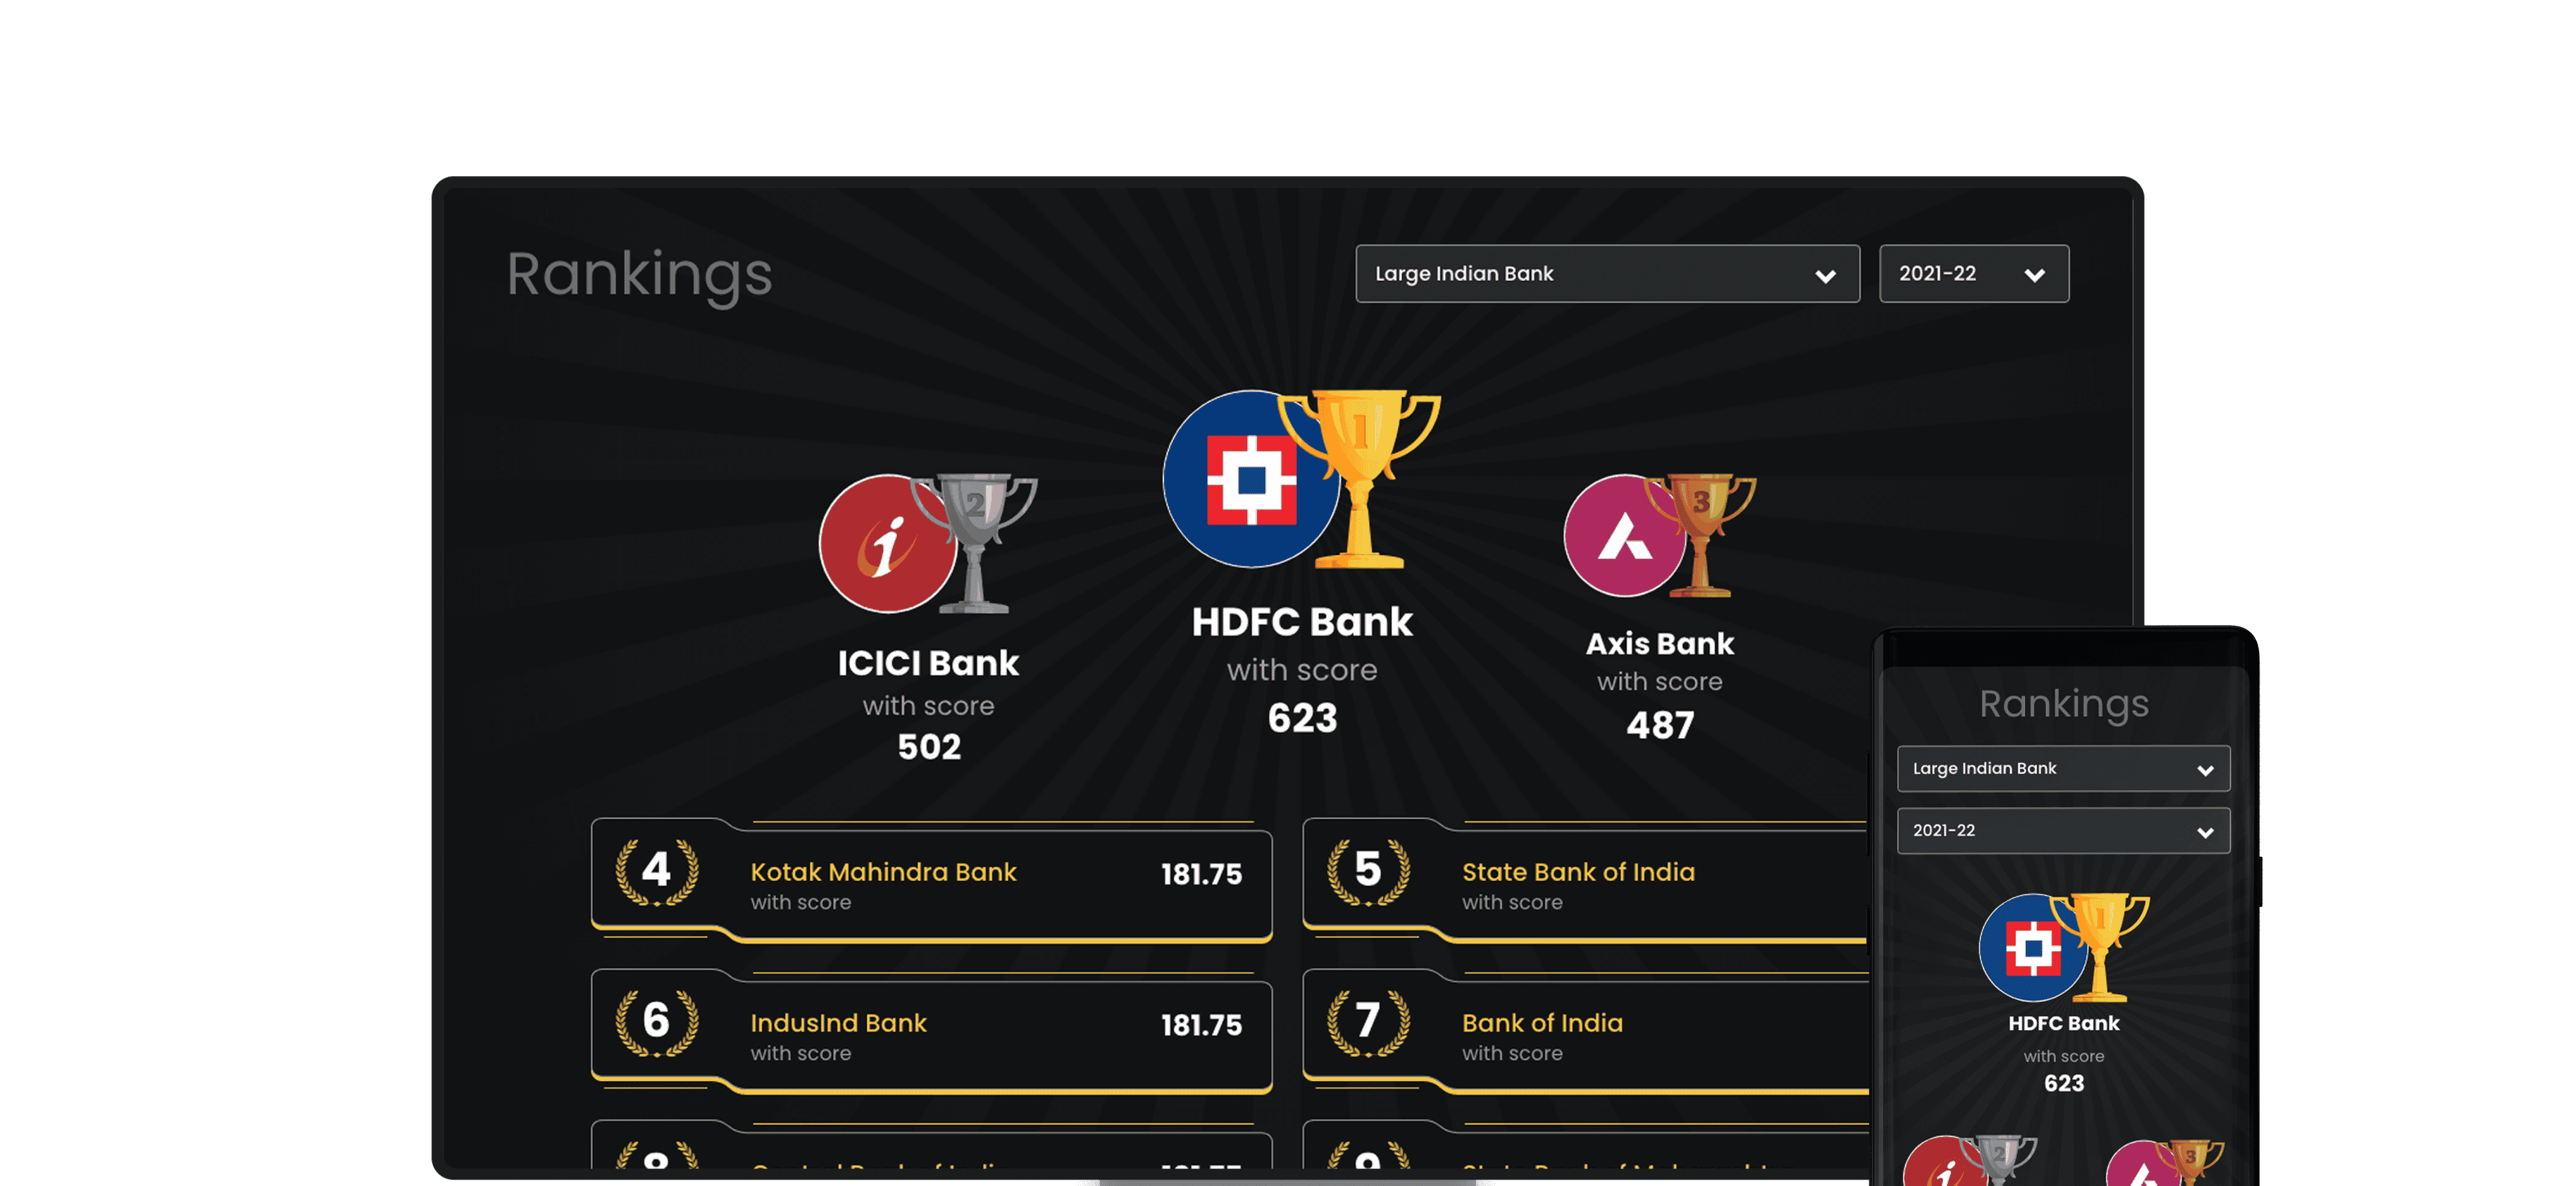
Best Banks Comparison
UI/UX Design, Data Design, Web, Mobile, Analytics
